## Diagram: Model Response Confidence and Accuracy
### Overview
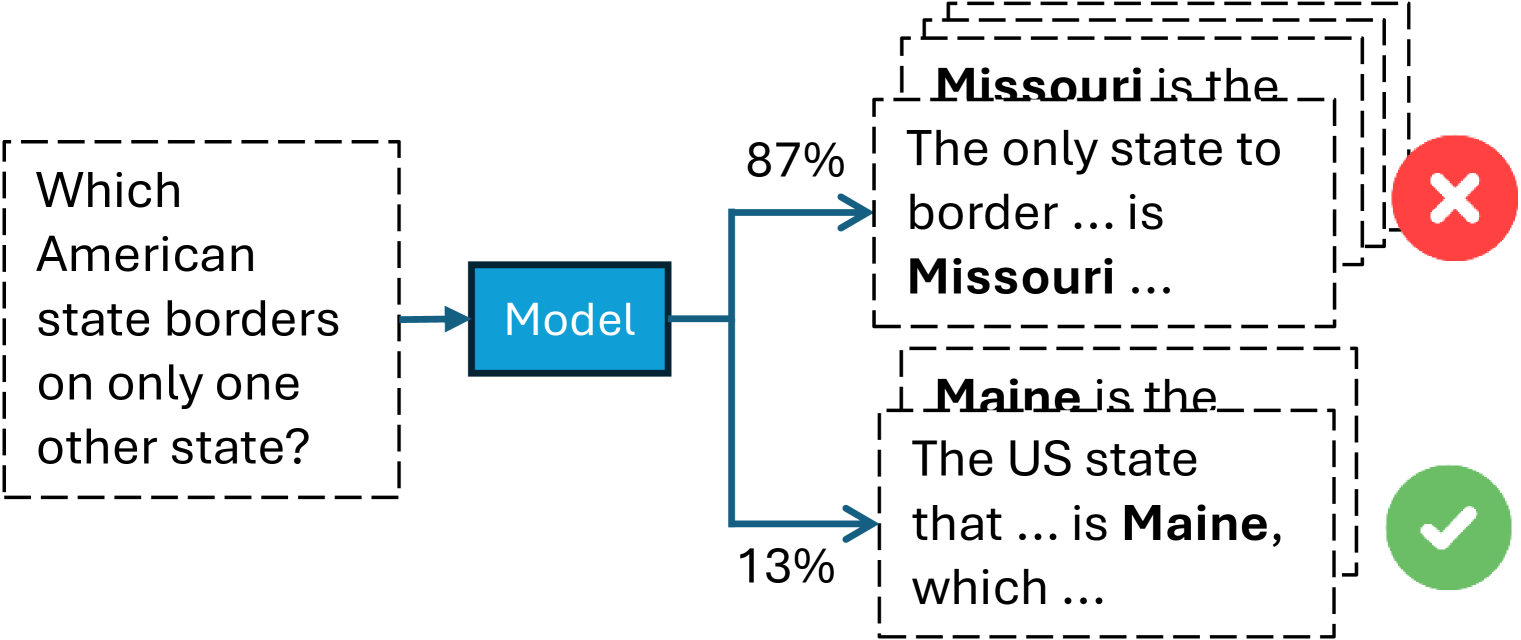
The image is a flowchart diagram illustrating a language model's response to a factual question. It shows the input question, the model processing it, and two possible output responses with associated confidence scores and correctness indicators. The diagram demonstrates a scenario where the model assigns high confidence to an incorrect answer and low confidence to the correct one.
### Components/Axes
The diagram is structured horizontally from left to right with the following components:
1. **Input Question (Left):** A dashed-line box containing the text: "Which American state borders on only one other state?"
2. **Model (Center):** A solid blue rectangle labeled "Model". An arrow points from the input question to this box.
3. **Output Paths (Right):** Two arrows branch from the "Model" box, leading to two separate output boxes.
* **Upper Path (Incorrect Answer):**
* Confidence Score: "87%" is written above the arrow.
* Output Box: A dashed-line box containing overlapping text. The primary visible text reads: "The only state to border ... is **Missouri** ..." with "Missouri" in bold. Partially visible text above reads: "**Missouri** is the".
* Correctness Indicator: A red circle with a white "X" is positioned to the right of this box.
* **Lower Path (Correct Answer):**
* Confidence Score: "13%" is written below the arrow.
* Output Box: A dashed-line box containing overlapping text. The primary visible text reads: "The US state that ... is **Maine**, which ..." with "Maine" in bold. Partially visible text above reads: "**Maine** is the".
* Correctness Indicator: A green circle with a white checkmark is positioned to the right of this box.
### Detailed Analysis
* **Flow:** Input Question → Model → Two concurrent output hypotheses.
* **Confidence Distribution:** The model's confidence is heavily skewed. It assigns an 87% probability to the incorrect answer ("Missouri") and only a 13% probability to the correct answer ("Maine").
* **Textual Content:** The output boxes contain what appear to be the beginnings of generated text responses. The bolded state names ("Missouri", "Maine") are the key entities in the answers. The ellipses (...) indicate truncated or continuing text.
* **Spatial Grounding:** The incorrect output (87%, Missouri) is placed above the correct output (13%, Maine). The correctness icons (X and checkmark) are aligned vertically on the far right, providing immediate visual feedback.
### Key Observations
1. **High-Confidence Error:** The most striking observation is the model's strong confidence (87%) in a factually incorrect statement. Missouri borders eight other states, not one.
2. **Low-Confidence Correctness:** The model correctly identifies Maine (which borders only New Hampshire) but assigns it a very low confidence score (13%).
3. **Output Presentation:** The overlapping text in the output boxes suggests these might be samples from a set of generated candidates or a visualization of the model's internal "thought" process considering multiple possibilities.
### Interpretation
This diagram serves as a clear visual critique of a common failure mode in large language models: **confident hallucination**. It demonstrates that a model's assigned probability or confidence score is not a reliable indicator of factual accuracy. The model has learned a strong but incorrect association (perhaps due to biases in training data where "Missouri" is frequently discussed in geographical contexts) and prioritizes it over the correct, but less statistically prominent, fact.
The relationship between the elements highlights the core challenge of AI alignment and reliability. The "Model" is a black box that transforms a clear question into a probabilistic distribution of answers, where the most likely output is wrong. This underscores the necessity for external verification, fact-checking mechanisms, and improved training techniques that better ground models in factual knowledge rather than just statistical patterns. The diagram is a succinct argument for why confidence scores alone should not be trusted for critical information retrieval.