## Chart: R1-Qwen | AIME24 Accuracy vs Ratio
### Overview
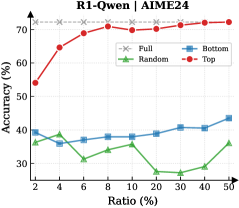
The image is a line chart comparing the accuracy of different strategies ("Full", "Random", "Bottom", "Top") against varying ratios. The x-axis represents the ratio in percentage, and the y-axis represents the accuracy in percentage.
### Components/Axes
* **Title:** R1-Qwen | AIME24
* **X-axis:** Ratio (%) with markers at 2, 4, 6, 8, 10, 20, 30, 40, 50
* **Y-axis:** Accuracy (%) with markers at 30, 40, 50, 60, 70
* **Legend:** Located in the top-right corner.
* Full (Gray dashed line with x markers)
* Random (Green line with triangle markers)
* Bottom (Blue line with square markers)
* Top (Red line with circle markers)
### Detailed Analysis
* **Full (Gray dashed line with x markers):** The accuracy is relatively constant at approximately 73% across all ratios.
* Ratio 2%: ~73%
* Ratio 50%: ~73%
* **Random (Green line with triangle markers):** The accuracy fluctuates between approximately 27% and 40%.
* Ratio 2%: ~37%
* Ratio 6%: ~31%
* Ratio 10%: ~36%
* Ratio 30%: ~27%
* Ratio 50%: ~35%
* **Bottom (Blue line with square markers):** The accuracy generally increases with the ratio, starting around 40% and reaching approximately 44%.
* Ratio 2%: ~40%
* Ratio 6%: ~38%
* Ratio 10%: ~38%
* Ratio 30%: ~40%
* Ratio 50%: ~44%
* **Top (Red line with circle markers):** The accuracy increases sharply from 54% to 71% between ratios 2% and 8%, then plateaus around 70-72%.
* Ratio 2%: ~54%
* Ratio 6%: ~69%
* Ratio 10%: ~70%
* Ratio 30%: ~72%
* Ratio 50%: ~73%
### Key Observations
* The "Full" strategy consistently provides the highest accuracy, remaining stable across all ratios.
* The "Top" strategy shows a rapid increase in accuracy initially, then plateaus.
* The "Bottom" strategy shows a gradual increase in accuracy as the ratio increases.
* The "Random" strategy has the lowest and most variable accuracy.
### Interpretation
The chart compares the performance of different strategies for a task (likely related to R1-Qwen and AIME24, which are probably model names or datasets). The "Full" strategy, which likely uses all available data, performs the best. The "Top" strategy, which might prioritize certain data points, shows a strong initial improvement but plateaus. The "Bottom" strategy, which might prioritize other data points, shows a gradual improvement. The "Random" strategy, which uses a random selection of data, performs the worst. This suggests that the selection of data points significantly impacts the accuracy of the model, and using all available data is the most effective approach.