## Line Chart: R1-Qwen | AIME24
### Overview
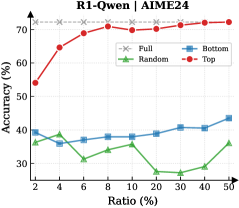
The image is a line chart comparing the performance of four different methods or configurations ("Full", "Bottom", "Random", "Top") on a task labeled "AIME24". Performance is measured by "Accuracy (%)" on the left vertical axis, plotted against a "Ratio (%)" on the horizontal axis. The chart demonstrates how accuracy changes for each method as the ratio parameter increases from 2% to 50%.
### Components/Axes
* **Chart Title:** "R1-Qwen | AIME24" (centered at the top).
* **Left Y-Axis:** Labeled "Accuracy (%)". Scale runs from 30 to 70 with major tick marks at 30, 40, 50, 60, 70.
* **Right Y-Axis:** Labeled "Ratio (%)". This axis appears to be a secondary axis, but its scale is not explicitly marked with values. It shares the same vertical space as the Accuracy axis.
* **X-Axis:** Labeled "Ratio (%)". The scale is non-linear, with marked points at 2, 4, 6, 8, 10, 20, 30, 40, 50.
* **Legend:** Positioned in the top-right corner of the chart area. It defines four data series:
* **Full:** Gray dashed line with 'x' markers.
* **Bottom:** Blue solid line with square markers.
* **Random:** Green solid line with triangle markers.
* **Top:** Red solid line with circle markers.
### Detailed Analysis
**Data Series Trends and Approximate Values:**
1. **Top (Red line, circle markers):**
* **Trend:** Shows a strong, consistent upward trend. Accuracy increases rapidly at low ratios and continues to climb steadily, approaching an asymptote near the top of the chart.
* **Key Points (Approximate):**
* Ratio 2%: ~54% Accuracy
* Ratio 4%: ~63% Accuracy
* Ratio 6%: ~67% Accuracy
* Ratio 8%: ~69% Accuracy
* Ratio 10%: ~70% Accuracy
* Ratio 20%: ~71% Accuracy
* Ratio 30%: ~72% Accuracy
* Ratio 40%: ~72.5% Accuracy
* Ratio 50%: ~73% Accuracy
2. **Full (Gray dashed line, 'x' markers):**
* **Trend:** Appears as a flat, horizontal line, indicating constant performance regardless of the ratio.
* **Key Point:** Maintains an accuracy of approximately 70% across all ratio values from 2% to 50%.
3. **Bottom (Blue line, square markers):**
* **Trend:** Shows a slight, gradual upward trend. It starts around 40% accuracy and increases slowly, with a more noticeable uptick at the highest ratios.
* **Key Points (Approximate):**
* Ratio 2%: ~40% Accuracy
* Ratio 4%: ~39% Accuracy
* Ratio 6%: ~38% Accuracy
* Ratio 8%: ~38% Accuracy
* Ratio 10%: ~39% Accuracy
* Ratio 20%: ~40% Accuracy
* Ratio 30%: ~41% Accuracy
* Ratio 40%: ~41% Accuracy
* Ratio 50%: ~43% Accuracy
4. **Random (Green line, triangle markers):**
* **Trend:** Exhibits high variability and a general downward trend. It fluctuates significantly, with a notable dip in the middle range (10-30%) before a slight recovery at the end.
* **Key Points (Approximate):**
* Ratio 2%: ~37% Accuracy
* Ratio 4%: ~38% Accuracy
* Ratio 6%: ~31% Accuracy
* Ratio 8%: ~34% Accuracy
* Ratio 10%: ~36% Accuracy
* Ratio 20%: ~26% Accuracy
* Ratio 30%: ~26% Accuracy
* Ratio 40%: ~27% Accuracy
* Ratio 50%: ~36% Accuracy
### Key Observations
1. **Performance Hierarchy:** There is a clear and consistent performance hierarchy: **Top > Full > Bottom > Random**. The "Top" method significantly outperforms all others, especially at higher ratios.
2. **Diverging Trends:** The "Top" and "Bottom" series show positive correlation with the ratio (accuracy improves as ratio increases), while the "Random" series shows a negative or unstable correlation. The "Full" series is invariant.
3. **Critical Point for Random:** The "Random" method performs worst in the 20-30% ratio range, suggesting a particular vulnerability or inefficiency in that operational zone.
4. **Convergence at High Ratio:** At the highest ratio (50%), the gap between "Bottom" and "Random" closes, with both ending near 36-43% accuracy, while "Top" and "Full" remain far above.
### Interpretation
This chart likely evaluates different data selection or sampling strategies ("Top", "Bottom", "Random") against a baseline ("Full") for a model named R1-Qwen on the AIME24 benchmark. The "Ratio (%)" probably represents the percentage of data used, a pruning threshold, or a similar resource constraint.
* **The "Top" strategy is highly effective,** suggesting that selecting the highest-quality or most relevant data (based on some metric) yields superior model accuracy, and this advantage scales with the amount of data/resources allocated.
* **The "Full" baseline is robust,** indicating that using all available data provides stable, high performance, but is ultimately surpassed by the intelligent curation of the "Top" method.
* **The "Bottom" strategy is marginally better than random,** implying that even selecting the worst-performing data (by some metric) contains more signal than pure chance, but is far from optimal.
* **The "Random" strategy's poor and erratic performance** serves as a control, highlighting that intelligent selection is crucial. Its dip in the middle range could indicate a phase where random sampling includes a detrimental mix of informative and noisy data points.
**Conclusion:** The data strongly advocates for a "Top"-based selection strategy over random or full-data approaches for this task, as it maximizes accuracy efficiently. The "Full" method is a reliable but sub-optimal fallback. The results underscore the importance of data quality and curation over mere quantity for the R1-Qwen model on the AIME24 task.