## Bar Chart: Prediction Flip Rate Comparison for Llama Models
### Overview
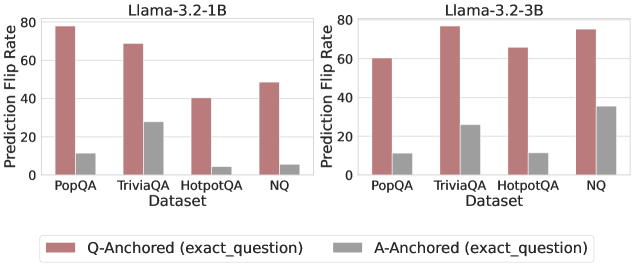
The image presents two bar charts comparing the prediction flip rates of two Llama models (Llama-3.2-1B and Llama-3.2-3B) across four different datasets: PopQA, TriviaQA, HotpotQA, and NQ. The charts compare the flip rates when anchoring on the question (Q-Anchored) versus anchoring on the answer (A-Anchored).
### Components/Axes
* **Titles:** The charts are titled "Llama-3.2-1B" (left) and "Llama-3.2-3B" (right).
* **Y-axis:** Labeled "Prediction Flip Rate," with a numerical scale from 0 to 80, incrementing by 20.
* **X-axis:** Labeled "Dataset," with categories: PopQA, TriviaQA, HotpotQA, and NQ.
* **Legend:** Located at the bottom of the image.
* Q-Anchored (exact\_question): Represented by a light brown/reddish bar.
* A-Anchored (exact\_question): Represented by a gray bar.
### Detailed Analysis
**Llama-3.2-1B (Left Chart):**
* **PopQA:**
* Q-Anchored: Approximately 78.
* A-Anchored: Approximately 12.
* **TriviaQA:**
* Q-Anchored: Approximately 69.
* A-Anchored: Approximately 28.
* **HotpotQA:**
* Q-Anchored: Approximately 48.
* A-Anchored: Approximately 5.
* **NQ:**
* Q-Anchored: Approximately 55.
* A-Anchored: Approximately 5.
**Llama-3.2-3B (Right Chart):**
* **PopQA:**
* Q-Anchored: Approximately 60.
* A-Anchored: Approximately 12.
* **TriviaQA:**
* Q-Anchored: Approximately 78.
* A-Anchored: Approximately 25.
* **HotpotQA:**
* Q-Anchored: Approximately 65.
* A-Anchored: Approximately 12.
* **NQ:**
* Q-Anchored: Approximately 75.
* A-Anchored: Approximately 35.
### Key Observations
* For both models, the Q-Anchored flip rates are consistently higher than the A-Anchored flip rates across all datasets.
* The difference between Q-Anchored and A-Anchored flip rates varies across datasets.
* The TriviaQA dataset shows the highest Q-Anchored flip rate for Llama-3.2-3B.
* The A-Anchored flip rates are generally low for both models, with NQ showing the highest A-Anchored flip rate for Llama-3.2-3B.
### Interpretation
The data suggests that anchoring on the question (Q-Anchored) leads to a higher prediction flip rate compared to anchoring on the answer (A-Anchored) for both Llama models. This indicates that the models are more sensitive to changes in the question than changes in the answer. The varying differences between Q-Anchored and A-Anchored flip rates across datasets suggest that the models' sensitivity to question changes is dataset-dependent. The higher Q-Anchored flip rates could be due to the models relying more on specific question wording or context, making them more susceptible to adversarial attacks or slight variations in the question. The lower A-Anchored flip rates suggest that the models are more robust to changes in the answer, possibly because the answer provides a more direct and stable signal for prediction.