\n
## Line Chart: Percentage of Charging Plugs Over Time
### Overview
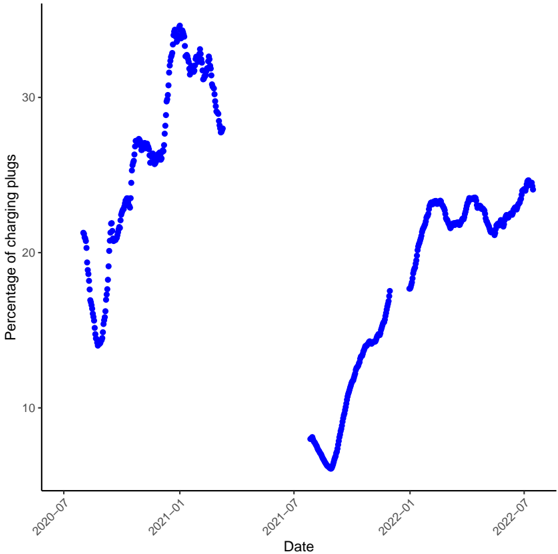
The image presents a line chart illustrating the percentage of charging plugs in use over a period from approximately July 2020 to July 2022. The chart displays a fluctuating trend with two distinct periods of increased usage.
### Components/Axes
* **X-axis:** Labeled "Date", spanning from approximately July 2020 to July 2022. The axis is marked with approximate dates: 2020-07, 2021-01, 2021-07, 2022-01, and 2022-07.
* **Y-axis:** Labeled "Percentage of charging plugs", ranging from 0 to 35. The axis is marked with values: 0, 10, 20, 30.
* **Data Series:** A single blue line representing the percentage of charging plugs.
* **No Legend:** There is no explicit legend, but the Y-axis label clearly identifies the data represented by the line.
### Detailed Analysis
The blue line representing the percentage of charging plugs exhibits the following trends:
* **2020-07 to 2021-01:** The line starts at approximately 14% in July 2020 and increases to around 25% by January 2021, with significant fluctuations.
* **2021-01 to 2021-07:** The line continues to rise, peaking at approximately 33% around March/April 2021, then declines to around 8% by July 2021.
* **2021-07 to 2022-01:** The line shows a steep increase from approximately 8% in July 2021 to around 24% by January 2022.
* **2022-01 to 2022-07:** The line plateaus around 24%, with minor fluctuations, reaching approximately 26% by July 2022.
Approximate data points (reading from the chart):
* 2020-07: 14%
* 2020-12: 22%
* 2021-01: 25%
* 2021-03: 33%
* 2021-07: 8%
* 2021-12: 20%
* 2022-01: 24%
* 2022-07: 26%
### Key Observations
* There is a clear seasonal or cyclical pattern in the data, with peaks in usage around the beginning of each year and a significant dip in the middle of 2021.
* The percentage of charging plugs used has generally increased over the two-year period, despite the fluctuations.
* The most significant drop in usage occurred between March and July 2021, followed by a rapid recovery.
### Interpretation
The chart suggests a growing adoption of charging plugs, as indicated by the overall upward trend. The fluctuations likely represent seasonal variations in demand, potentially related to travel patterns, weather conditions, or other external factors. The sharp decline in mid-2021 could be due to a specific event or change in circumstances that temporarily reduced the need for charging. The data could represent the usage of electric vehicle charging stations, or potentially charging stations for other devices. The consistent increase in usage from late 2021 to 2022 suggests a sustained growth in demand for charging infrastructure. Further investigation would be needed to understand the underlying causes of the observed patterns and to predict future trends.