TECHNICAL ASSET FINGERPRINT
dea4b28cb2ad711db047becf
Click to view fullscreen
Press ESC or click to close
FOUND IN PAPERS
EXPERT: healer-alpha-free VERSION 1
RUNTIME: free/openrouter/healer-alpha
INTEL_VERIFIED
## [Multi-Panel Chart]: Human Consistency and Model Accuracy Analysis
### Overview
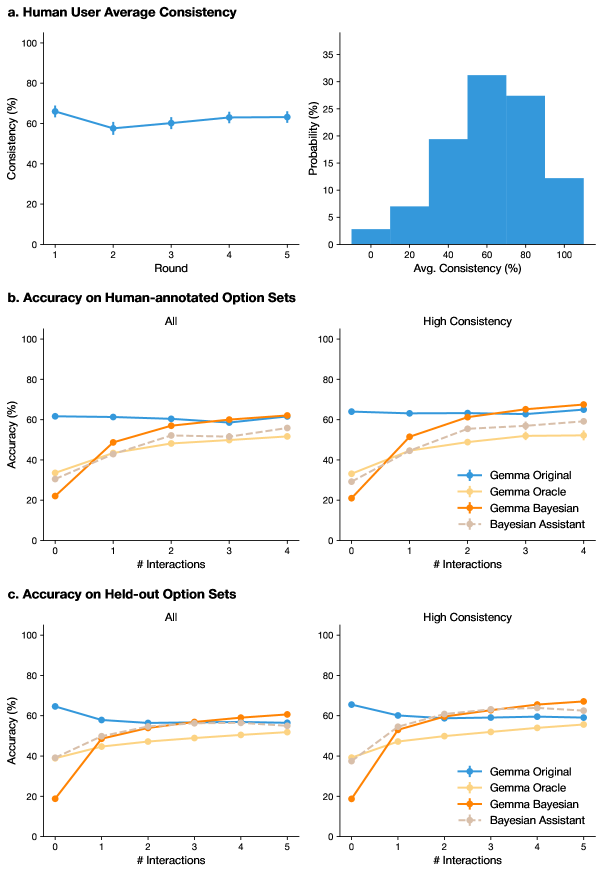
The image is a composite figure containing three main panels (a, b, c), each presenting statistical analyses related to human user consistency and the accuracy of different AI models (Gemma variants and a Bayesian Assistant) across multiple interaction rounds. The data appears to come from a study evaluating model performance in a task involving option sets, with results broken down by all data and a "High Consistency" subset.
### Components/Axes
The figure is divided into three horizontal panels, each with a title:
* **Panel a:** "Human User Average Consistency"
* **Panel b:** "Accuracy on Human-annotated Option Sets"
* **Panel c:** "Accuracy on Held-out Option Sets"
**Panel a Components:**
1. **Left Chart (Line Graph):**
* **Title:** Human User Average Consistency
* **Y-axis:** "Consistency (%)" ranging from 0 to 100.
* **X-axis:** "Round" with discrete markers at 1, 2, 3, 4, 5.
* **Data Series:** A single blue line with diamond markers.
2. **Right Chart (Histogram):**
* **Y-axis:** "Probability (%)" ranging from 0 to 35.
* **X-axis:** "Avg. Consistency (%)" with bins labeled 0, 20, 40, 60, 80, 100.
* **Data Series:** A series of blue vertical bars representing a probability distribution.
**Panel b & c Components (Identical Structure):**
Each panel contains two side-by-side line charts.
1. **Left Chart:** Subtitled "All".
2. **Right Chart:** Subtitled "High Consistency".
3. **Shared Axes:**
* **Y-axis:** "Accuracy (%)" ranging from 0 to 100.
* **X-axis:** "# Interactions". Panel b ranges from 0 to 4. Panel c ranges from 0 to 5.
4. **Legend (Present in the right chart of each panel, bottom-right corner):**
* **Gemma Original:** Blue line with diamond markers.
* **Gemma Oracle:** Light orange line with circle markers.
* **Gemma Bayesian:** Dark orange line with diamond markers.
* **Bayesian Assistant:** Gray dashed line with circle markers.
### Detailed Analysis
**Panel a: Human User Average Consistency**
* **Line Graph Trend:** The blue line shows a slight dip from Round 1 to Round 2, then a gradual, shallow upward trend through Round 5.
* **Approximate Data Points:**
* Round 1: ~65%
* Round 2: ~58%
* Round 3: ~60%
* Round 4: ~63%
* Round 5: ~63%
* **Histogram Distribution:** The distribution of average consistency across users is roughly unimodal and slightly left-skewed.
* **Approximate Probabilities by Bin:**
* 0-20%: ~3%
* 20-40%: ~7%
* 40-60%: ~19%
* 60-80%: ~31% (Mode)
* 80-100%: ~27%
* >100%: ~12% (Note: This bin extends beyond the 100% label, suggesting some values may be slightly above 100% or the binning is inclusive).
**Panel b: Accuracy on Human-annotated Option Sets**
* **"All" Data Chart:**
* **Gemma Original (Blue):** Starts high (~61% at 0 interactions) and remains nearly flat, ending at ~61% at 4 interactions.
* **Gemma Oracle (Light Orange):** Starts low (~32% at 0), rises steadily to ~51% at 4 interactions.
* **Gemma Bayesian (Dark Orange):** Starts lowest (~21% at 0), shows the steepest increase, surpassing Gemma Oracle around 2 interactions, and ends highest at ~62% at 4 interactions.
* **Bayesian Assistant (Gray Dashed):** Starts at ~33% at 0, increases steadily to ~56% at 4 interactions.
* **"High Consistency" Data Chart:**
* **Gemma Original (Blue):** Starts at ~64% at 0, remains flat until a slight rise to ~65% at 4 interactions.
* **Gemma Oracle (Light Orange):** Starts at ~33% at 0, rises to ~52% at 4 interactions.
* **Gemma Bayesian (Dark Orange):** Starts at ~21% at 0, rises sharply to ~67% at 4 interactions, becoming the top performer.
* **Bayesian Assistant (Gray Dashed):** Starts at ~34% at 0, rises to ~62% at 4 interactions.
**Panel c: Accuracy on Held-out Option Sets**
* **"All" Data Chart:**
* **Gemma Original (Blue):** Starts at ~64% at 0, declines to ~57% at 1 interaction, then slowly recovers to ~61% at 5 interactions.
* **Gemma Oracle (Light Orange):** Starts at ~40% at 0, rises to ~53% at 5 interactions.
* **Gemma Bayesian (Dark Orange):** Starts at ~19% at 0, rises steeply to ~61% at 5 interactions.
* **Bayesian Assistant (Gray Dashed):** Starts at ~40% at 0, rises to ~59% at 5 interactions.
* **"High Consistency" Data Chart:**
* **Gemma Original (Blue):** Starts at ~65% at 0, dips to ~60% at 1, and ends at ~59% at 5 interactions.
* **Gemma Oracle (Light Orange):** Starts at ~39% at 0, rises to ~55% at 5 interactions.
* **Gemma Bayesian (Dark Orange):** Starts at ~19% at 0, rises sharply to ~67% at 5 interactions.
* **Bayesian Assistant (Gray Dashed):** Starts at ~39% at 0, rises to ~64% at 5 interactions.
### Key Observations
1. **Human Consistency:** Human user consistency is moderate (averaging around 60-65%) and relatively stable across rounds, with most users falling in the 60-80% consistency range.
2. **Model Learning Curves:** All models except "Gemma Original" show a clear positive learning curve, with accuracy improving as the number of interactions increases.
3. **Bayesian Model Superiority:** The "Gemma Bayesian" model consistently shows the most dramatic improvement, starting from the lowest accuracy at 0 interactions but often achieving the highest or near-highest accuracy by the final interaction, especially in the "High Consistency" subsets.
4. **Impact of Data Subset:** Models generally achieve higher final accuracy scores on the "High Consistency" data subsets compared to the "All" data subsets in both panels b and c.
5. **Gemma Original Plateau:** The "Gemma Original" model shows little to no improvement with more interactions, suggesting it may not be adapting or learning within this interaction framework.
### Interpretation
This data suggests a study where AI models are iteratively refined or queried over multiple interactions to perform a task (likely involving selecting or evaluating options). The key findings are:
* **The value of iterative interaction:** Models that incorporate Bayesian updating (Gemma Bayesian, Bayesian Assistant) leverage additional interactions to significantly improve their accuracy, while the base model (Gemma Original) does not.
* **Human data as a filter:** Performance is notably better when evaluated on option sets where human users were highly consistent. This implies that model accuracy is sensitive to the clarity or consensus of the underlying task, and high human consistency may indicate a less ambiguous problem space where models can excel.
* **Cold-start problem:** The Bayesian models start with very low accuracy at zero interactions but overcome this quickly. This highlights a potential trade-off: these models may require a few interactions to "warm up" and gather sufficient data to make accurate predictions, but their ceiling for improvement is higher.
* **Task Difficulty:** The general trend of improvement across interactions for most models indicates the task is learnable. The initial low scores for Bayesian models might reflect a deliberate exploration phase or a prior that is updated with interaction data.
In essence, the figure argues for the efficacy of Bayesian approaches in interactive learning settings, particularly when dealing with data that has a strong signal of human consensus.
DECODING INTELLIGENCE...