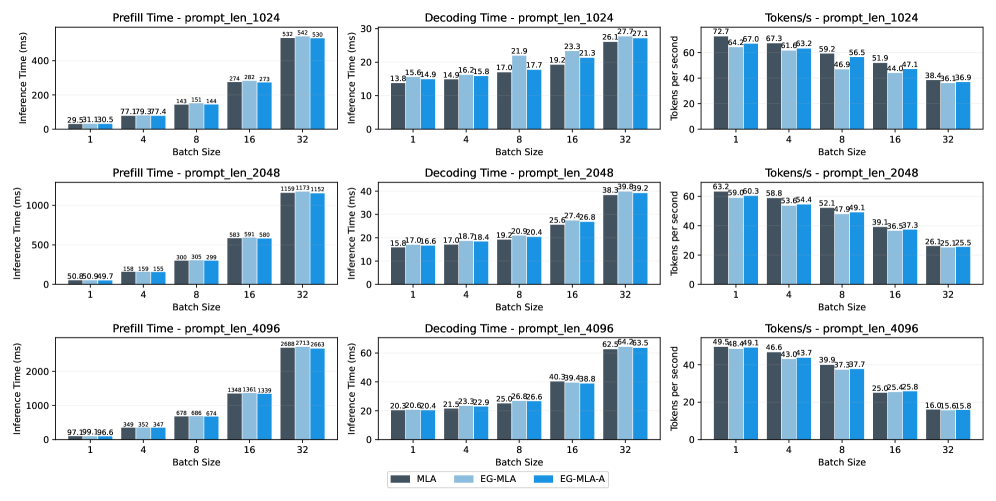
## Bar Chart Grid: Performance Comparison of MLA, EG-MLA, and EG-MLA-A
### Overview
This image presents a 3x3 grid of bar charts comparing the performance of three different methods—**MLA** (dark grey), **EG-MLA** (light blue), and **EG-MLA-A** (medium blue)—across varying batch sizes (1, 4, 8, 16, 32) and prompt lengths (1024, 2048, 4096). The metrics evaluated are **Prefill Time (ms)**, **Decoding Time (ms)**, and **Tokens/s**.
### Components/Axes
* **Legend (Bottom Center):**
* **MLA:** Dark Grey bar
* **EG-MLA:** Light Blue bar
* **EG-MLA-A:** Medium Blue bar
* **Grid Structure:**
* **Rows (Top to Bottom):** Prompt Length 1024, Prompt Length 2048, Prompt Length 4096.
* **Columns (Left to Right):** Prefill Time (ms), Decoding Time (ms), Tokens/s.
* **Axes:**
* **X-Axis:** Batch Size (1, 4, 8, 16, 32).
* **Y-Axis:** Varies by column (Inference Time in milliseconds or Tokens per second).
---
### Detailed Analysis
#### Row 1: Prompt Length 1024
* **Prefill Time (ms):** Values increase with batch size. MLA is consistently the fastest (lowest time).
* Batch 1: MLA 29.5, EG-MLA 31