## Line Chart: Pass Rate vs. Steps for SFT and RL Priors
### Overview
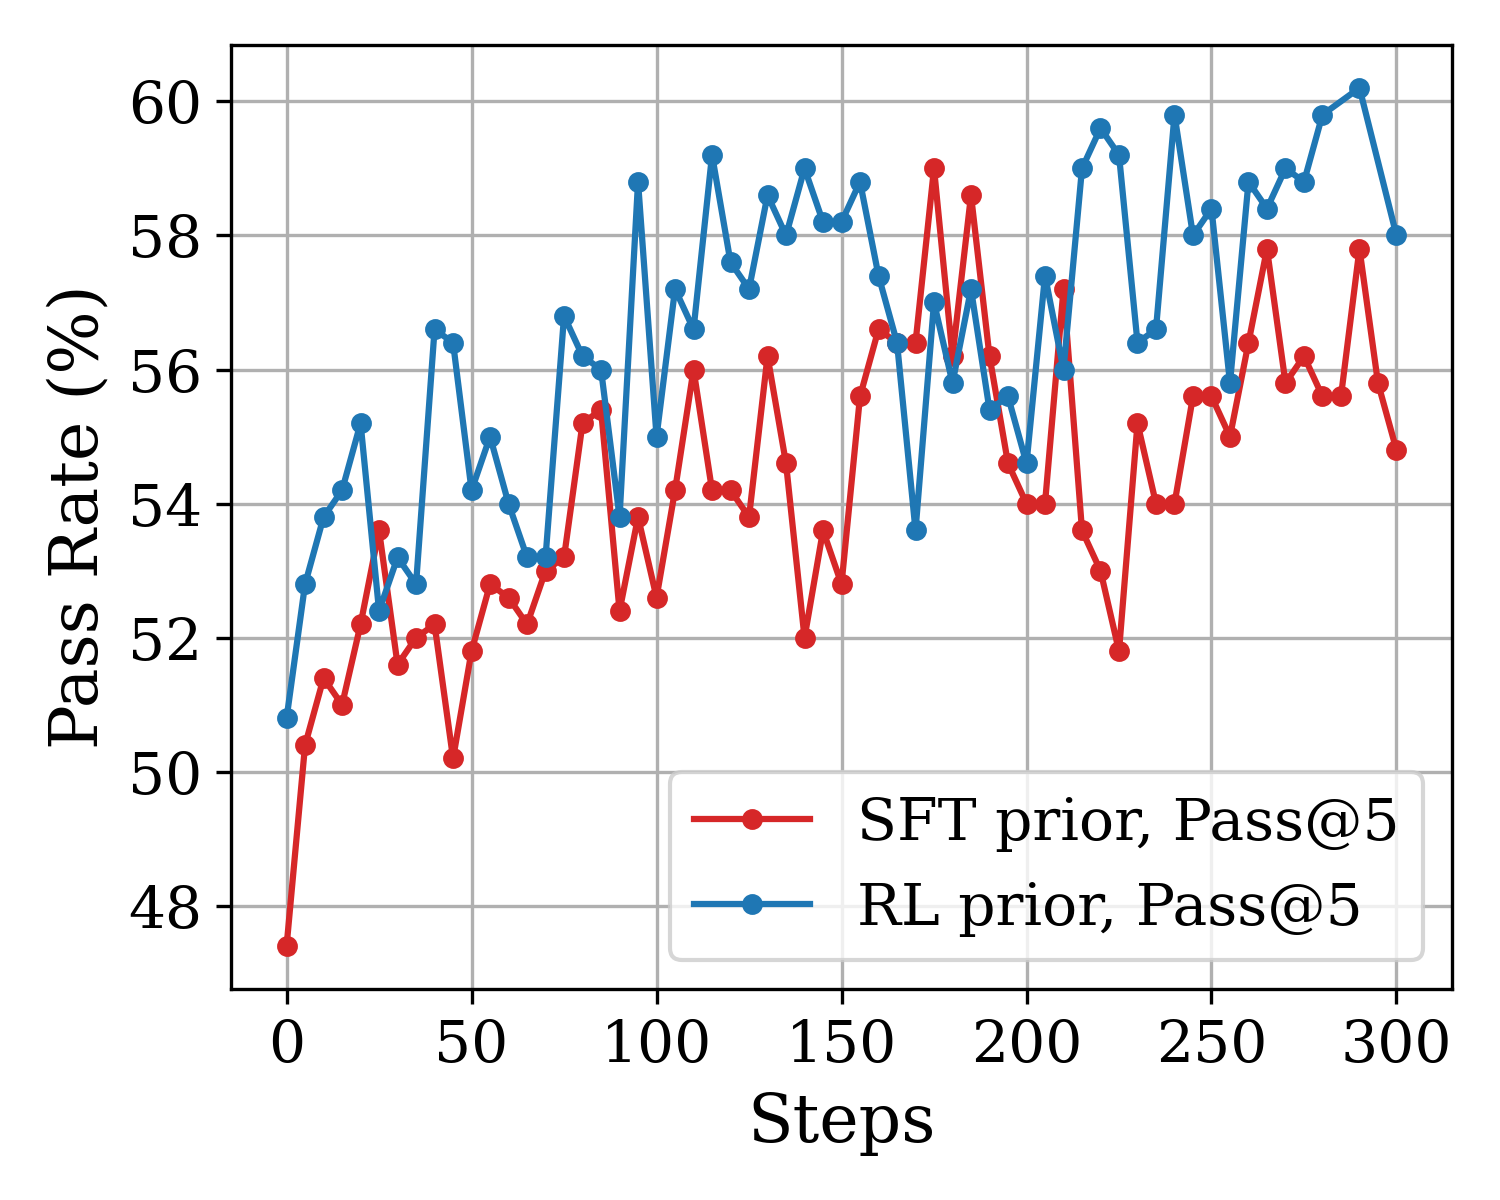
This image is a line chart comparing the performance of two different machine learning models or training methodologies over a series of training steps. The performance is measured by a "Pass Rate (%)" metric, specifically "Pass@5". The chart displays two highly volatile data series that both exhibit an overall upward trend over time.
### Components/Axes
**Component Isolation & Spatial Grounding:**
* **Main Chart Area:** Occupies the center and upper portions of the image, featuring a light gray grid background.
* **Y-Axis (Left edge):**
* **Label:** "Pass Rate (%)" (Oriented vertically, reading bottom to top).
* **Scale:** Linear, ranging from below 48 to above 60.
* **Markers/Ticks:** Explicitly labeled at 48, 50, 52, 54, 56, 58, and 60. Horizontal grid lines extend from these markers across the chart.
* **X-Axis (Bottom edge):**
* **Label:** "Steps" (Centered below the axis).
* **Scale:** Linear, ranging from 0 to 300.
* **Markers/Ticks:** Explicitly labeled at 0, 50, 100, 150, 200, 250, and 300. Vertical grid lines extend upward from these markers.
* **Legend (Bottom-Right quadrant):** Enclosed in a white box with a light gray border, positioned in the lower right area of the main chart grid.
* **Red line with circular marker:** Labeled "SFT prior, Pass@5"
* **Blue line with circular marker:** Labeled "RL prior, Pass@5"
### Detailed Analysis
*Note: Data points are plotted approximately every 5 steps. Due to the density of the points, values below are extracted at major axis intervals and notable peaks/troughs to accurately reconstruct the visual trends. Values are approximate (±0.5%).*
**Trend Verification 1: RL prior, Pass@5 (Blue Line)**
* **Visual Trend:** The blue line begins near 51%, experiences a rapid initial climb, and then enters a highly volatile phase characterized by sharp peaks and deep valleys. Despite the volatility, the moving average trends upward, generally staying above the red line, and finishes near 58%.
* **Extracted Data Points (Approximate):**
* Step 0: ~50.8%
* Step 20: ~55.2% (Local peak)
* Step 50: ~54.2%
* Step 75: ~56.8%
* Step 95: ~58.8% (Sharp peak)
* Step 100: ~55.0% (Sharp drop)
* Step 150: ~58.2%
* Step 170: ~53.6% (Deep trough)
* Step 200: ~54.6%
* Step 220: ~59.6% (High peak)
* Step 250: ~58.4%
* Step 290: ~60.2% (Highest recorded peak on chart)
* Step 300: ~58.0%
**Trend Verification 2: SFT prior, Pass@5 (Red Line)**
* **Visual Trend:** The red line starts significantly lower than the blue line, below 48%. It also exhibits extreme volatility (a "sawtooth" pattern). While it trends upward over the 300 steps, it generally remains below the blue line, with only a few brief spikes where it matches or exceeds the blue line's performance. It finishes near 55%.
* **Extracted Data Points (Approximate):**
* Step 0: ~47.4% (Lowest point on chart)
* Step 25: ~53.6%
* Step 45: ~50.2% (Deep trough)
* Step 50: ~51.8%
* Step 100: ~52.6%
* Step 130: ~56.2% (Local peak)
* Step 150: ~52.8%
* Step 175: ~59.0% (Highest peak for red line, briefly surpassing blue)
* Step 200: ~54.0%
* Step 225: ~51.8% (Deep trough)
* Step 250: ~55.6%
* Step 290: ~57.8% (Local peak)
* Step 300: ~54.8%
### Key Observations
1. **Performance Gap:** The "RL prior" (blue) consistently demonstrates a higher Pass Rate than the "SFT prior" (red) across the majority of the 300 steps.
2. **Initial State:** There is a significant gap in initial performance at Step 0, with the RL prior starting roughly 3.4% higher than the SFT prior.
3. **High Variance:** Both training methods exhibit extreme step-to-step volatility. A rise of 3-4% in one 5-step interval is frequently followed by an immediate drop of similar magnitude.
4. **Convergence/Divergence:** While the red line occasionally spikes to meet the blue line (most notably around Step 175), the blue line maintains a higher baseline. Toward the end of the chart (Steps 280-300), the gap between the two lines appears to widen again.
### Interpretation
This chart visualizes the evaluation phase of a machine learning model, likely in the domain of code generation or complex reasoning, given the "Pass@5" metric (which measures if the correct answer is present within the top 5 generated outputs).
The data strongly suggests that initializing the training process with a Reinforcement Learning (RL) prior yields superior results compared to a Supervised Fine-Tuning (SFT) prior. The RL prior not only provides a better starting baseline ("zero-shot" or initial step performance) but also maintains a higher performance ceiling throughout the observed training window.
The extreme jaggedness of both lines indicates high variance in the evaluation process. This could be due to a small evaluation dataset, a highly sensitive metric, or inherent instability in the model's learning dynamics at this specific learning rate or phase. Despite this noise, the underlying signal is clear: the RL prior is the more effective methodology for maximizing the Pass@5 rate over these 300 steps.