## Stacked Bar Chart: Rating Distribution by Model
### Overview
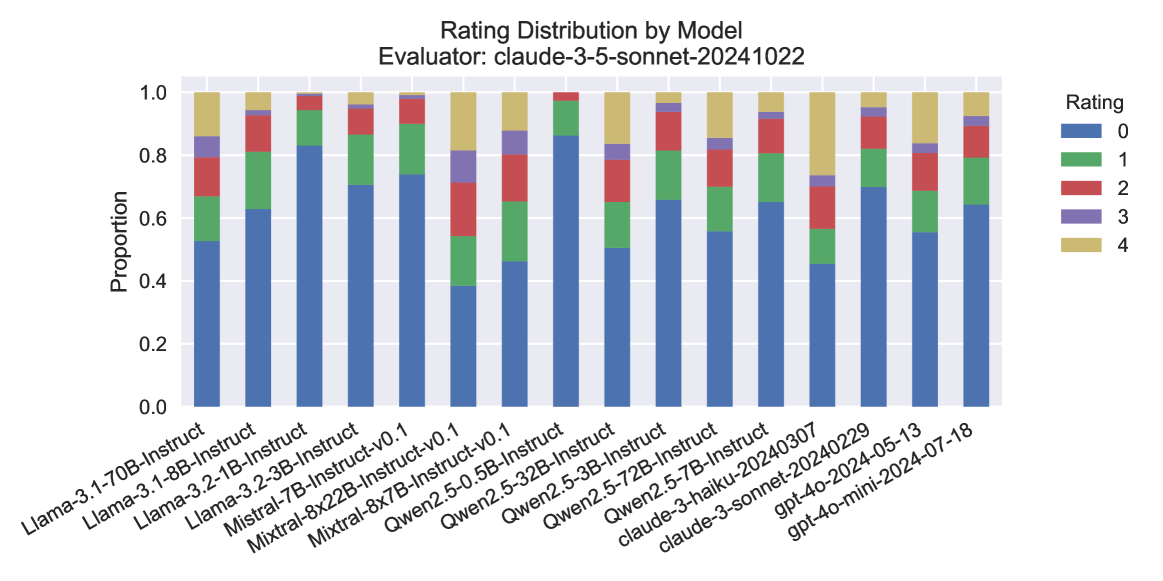
The image is a stacked bar chart illustrating the distribution of ratings for various language models. The x-axis represents different models, and the y-axis represents the proportion of each rating (0-4). The chart also specifies the evaluator used: "claude-3-5-sonnet-20241022".
### Components/Axes
* **Title:** Rating Distribution by Model
* **Subtitle:** Evaluator: claude-3-5-sonnet-20241022
* **X-axis:** Language Models (categorical):
* Llama-3.1-70B-Instruct
* Llama-3.1-8B-Instruct
* Llama-3.2-1B-Instruct
* Llama-3.2-3B-Instruct
* Mistral-7B-Instruct-v0.1
* Mixtral-8x22B-Instruct-v0.1
* Mixtral-8x7B-Instruct-v0.1
* Qwen2.5-0.5B-Instruct
* Qwen2.5-32B-Instruct
* Qwen2.5-3B-Instruct
* Qwen2.5-72B-Instruct
* Qwen2.5-7B-Instruct
* claude-3-haiku-20240307
* claude-3-sonnet-20240229
* gpt-4o-2024-05-13
* gpt-4o-mini-2024-07-18
* **Y-axis:** Proportion (numerical), ranging from 0.0 to 1.0 in increments of 0.2.
* **Legend:** Located on the top-right of the chart.
* Blue: 0
* Green: 1
* Red: 2
* Purple: 3
* Tan/Beige: 4
### Detailed Analysis
The chart displays the proportion of each rating (0 to 4) for each language model. Each bar represents a model, and the height of each colored segment within the bar indicates the proportion of that rating for the model.
* **Llama-3.1-70B-Instruct:**
* Rating 0 (Blue): ~0.6
* Rating 1 (Green): ~0.2
* Rating 2 (Red): ~0.1
* Rating 3 (Purple): ~0.05
* Rating 4 (Tan): ~0.05
* **Llama-3.1-8B-Instruct:**
* Rating 0 (Blue): ~0.6
* Rating 1 (Green): ~0.2
* Rating 2 (Red): ~0.1
* Rating 3 (Purple): ~0.05
* Rating 4 (Tan): ~0.05
* **Llama-3.2-1B-Instruct:**
* Rating 0 (Blue): ~0.6
* Rating 1 (Green): ~0.2
* Rating 2 (Red): ~0.1
* Rating 3 (Purple): ~0.05
* Rating 4 (Tan): ~0.05
* **Llama-3.2-3B-Instruct:**
* Rating 0 (Blue): ~0.6
* Rating 1 (Green): ~0.2
* Rating 2 (Red): ~0.1
* Rating 3 (Purple): ~0.05
* Rating 4 (Tan): ~0.05
* **Mistral-7B-Instruct-v0.1:**
* Rating 0 (Blue): ~0.5
* Rating 1 (Green): ~0.2
* Rating 2 (Red): ~0.15
* Rating 3 (Purple): ~0.1
* Rating 4 (Tan): ~0.05
* **Mixtral-8x22B-Instruct-v0.1:**
* Rating 0 (Blue): ~0.45
* Rating 1 (Green): ~0.25
* Rating 2 (Red): ~0.15
* Rating 3 (Purple): ~0.1
* Rating 4 (Tan): ~0.05
* **Mixtral-8x7B-Instruct-v0.1:**
* Rating 0 (Blue): ~0.4
* Rating 1 (Green): ~0.3
* Rating 2 (Red): ~0.15
* Rating 3 (Purple): ~0.1
* Rating 4 (Tan): ~0.05
* **Qwen2.5-0.5B-Instruct:**
* Rating 0 (Blue): ~0.7
* Rating 1 (Green): ~0.15
* Rating 2 (Red): ~0.05
* Rating 3 (Purple): ~0.05
* Rating 4 (Tan): ~0.05
* **Qwen2.5-32B-Instruct:**
* Rating 0 (Blue): ~0.8
* Rating 1 (Green): ~0.1
* Rating 2 (Red): ~0.05
* Rating 3 (Purple): ~0.02
* Rating 4 (Tan): ~0.03
* **Qwen2.5-3B-Instruct:**
* Rating 0 (Blue): ~0.6
* Rating 1 (Green): ~0.2
* Rating 2 (Red): ~0.1
* Rating 3 (Purple): ~0.05
* Rating 4 (Tan): ~0.05
* **Qwen2.5-72B-Instruct:**
* Rating 0 (Blue): ~0.7
* Rating 1 (Green): ~0.15
* Rating 2 (Red): ~0.05
* Rating 3 (Purple): ~0.05
* Rating 4 (Tan): ~0.05
* **Qwen2.5-7B-Instruct:**
* Rating 0 (Blue): ~0.6
* Rating 1 (Green): ~0.2
* Rating 2 (Red): ~0.1
* Rating 3 (Purple): ~0.05
* Rating 4 (Tan): ~0.05
* **claude-3-haiku-20240307:**
* Rating 0 (Blue): ~0.5
* Rating 1 (Green): ~0.2
* Rating 2 (Red): ~0.15
* Rating 3 (Purple): ~0.1
* Rating 4 (Tan): ~0.05
* **claude-3-sonnet-20240229:**
* Rating 0 (Blue): ~0.8
* Rating 1 (Green): ~0.1
* Rating 2 (Red): ~0.05
* Rating 3 (Purple): ~0.02
* Rating 4 (Tan): ~0.03
* **gpt-4o-2024-05-13:**
* Rating 0 (Blue): ~0.6
* Rating 1 (Green): ~0.2
* Rating 2 (Red): ~0.1
* Rating 3 (Purple): ~0.05
* Rating 4 (Tan): ~0.05
* **gpt-4o-mini-2024-07-18:**
* Rating 0 (Blue): ~0.6
* Rating 1 (Green): ~0.2
* Rating 2 (Red): ~0.1
* Rating 3 (Purple): ~0.05
* Rating 4 (Tan): ~0.05
### Key Observations
* Most models have a high proportion of rating 0.
* Ratings 3 and 4 have the lowest proportions across all models.
* The Qwen models tend to have a higher proportion of rating 0 compared to the other models.
* The Mixtral models have a relatively higher proportion of ratings 1, 2, and 3 compared to the other models.
### Interpretation
The chart provides a comparative overview of how different language models are rated by the "claude-3-5-sonnet-20241022" evaluator. The dominance of rating 0 suggests that, according to this evaluator, many of the models are frequently assigned the lowest rating. The variations in rating distributions among the models indicate differences in their performance or characteristics as perceived by the evaluator. The Mixtral models seem to receive more diverse ratings, while the Qwen models are more heavily skewed towards the lowest rating. This information can be valuable for understanding the relative strengths and weaknesses of these models and for guiding further development and refinement efforts.