TECHNICAL ASSET FINGERPRINT
dee216170bde4225546055aa
Click to view fullscreen
Press ESC or click to close
FOUND IN PAPERS
EXPERT: gemini-2.5-flash-lite-free VERSION 1
RUNTIME: google-free/gemini-2.5-flash-lite
INTEL_VERIFIED
## Stacked Bar Chart: Rating Distribution by Model
### Overview
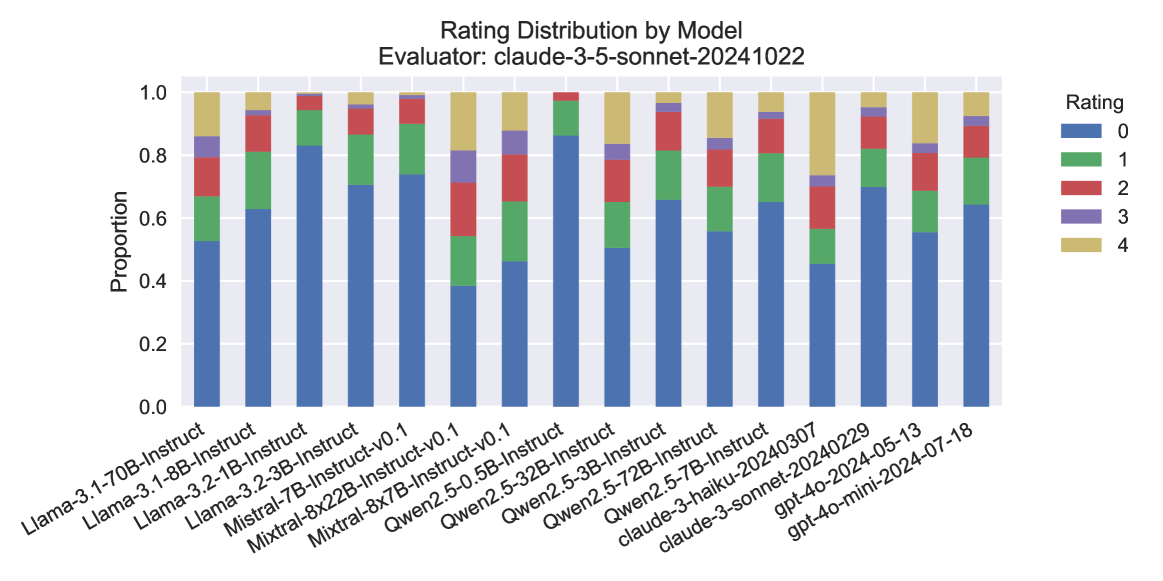
This image displays a stacked bar chart showing the distribution of ratings (0 through 4) for various language models, as evaluated by "claude-3-5-sonnet-20241022". Each bar represents a specific model, and the segments within each bar indicate the proportion of responses that received each rating. The chart is designed to visually compare the rating profiles of different models.
### Components/Axes
* **Title:** "Rating Distribution by Model"
* **Subtitle:** "Evaluator: claude-3-5-sonnet-20241022"
* **Y-axis Title:** "Proportion"
* **Y-axis Scale:** Ranges from 0.0 to 1.0, with major ticks at 0.0, 0.2, 0.4, 0.6, 0.8, and 1.0.
* **X-axis Labels:** These are the names of the different models being evaluated. They are rotated for readability and include:
* Llama-3.1-70B-Instruct
* Llama-3.1-8B-Instruct
* Llama-3.2-1B-Instruct
* Llama-3.2-3B-Instruct
* Mistral-7B-Instruct
* Mistral-8x22B-Instruct-v0.1
* Qwen2.5-0.5B-Instruct-v0.1
* Qwen2.5-2B-Instruct
* Qwen2.5-5.3B-Instruct
* Qwen2.5-72B-Instruct
* claude-3-haiku-20240307
* claude-3-sonnet-20240229
* gpt-4o-20240513
* gpt-4o-mini-2024-07-18
* **Legend:** Located in the top-right corner of the chart. It maps colors to rating values:
* Blue: Rating 0
* Green: Rating 1
* Red: Rating 2
* Purple: Rating 3
* Yellow: Rating 4
### Detailed Analysis
The chart displays 14 distinct models. For each model, the bar is segmented from bottom to top, representing the proportion of ratings from 0 to 4.
* **Llama-3.1-70B-Instruct:**
* Rating 0 (Blue): Approximately 0.55 (55%)
* Rating 1 (Green): Approximately 0.15 (15%), cumulative proportion ~0.70
* Rating 2 (Red): Approximately 0.10 (10%), cumulative proportion ~0.80
* Rating 3 (Purple): Approximately 0.05 (5%), cumulative proportion ~0.85
* Rating 4 (Yellow): Approximately 0.15 (15%), cumulative proportion ~1.00
* **Llama-3.1-8B-Instruct:**
* Rating 0 (Blue): Approximately 0.98 (98%)
* Rating 1 (Green): Approximately 0.01 (1%), cumulative proportion ~0.99
* Rating 2 (Red): Negligible, cumulative proportion ~0.99
* Rating 3 (Purple): Negligible, cumulative proportion ~0.99
* Rating 4 (Yellow): Approximately 0.01 (1%), cumulative proportion ~1.00
* **Llama-3.2-1B-Instruct:**
* Rating 0 (Blue): Approximately 0.98 (98%)
* Rating 1 (Green): Approximately 0.01 (1%), cumulative proportion ~0.99
* Rating 2 (Red): Negligible, cumulative proportion ~0.99
* Rating 3 (Purple): Negligible, cumulative proportion ~0.99
* Rating 4 (Yellow): Approximately 0.01 (1%), cumulative proportion ~1.00
* **Llama-3.2-3B-Instruct:**
* Rating 0 (Blue): Approximately 0.98 (98%)
* Rating 1 (Green): Approximately 0.01 (1%), cumulative proportion ~0.99
* Rating 2 (Red): Negligible, cumulative proportion ~0.99
* Rating 3 (Purple): Negligible, cumulative proportion ~0.99
* Rating 4 (Yellow): Approximately 0.01 (1%), cumulative proportion ~1.00
* **Mistral-7B-Instruct:**
* Rating 0 (Blue): Approximately 0.68 (68%)
* Rating 1 (Green): Approximately 0.15 (15%), cumulative proportion ~0.83
* Rating 2 (Red): Approximately 0.08 (8%), cumulative proportion ~0.91
* Rating 3 (Purple): Approximately 0.03 (3%), cumulative proportion ~0.94
* Rating 4 (Yellow): Approximately 0.06 (6%), cumulative proportion ~1.00
* **Mistral-8x22B-Instruct-v0.1:**
* Rating 0 (Blue): Approximately 0.42 (42%)
* Rating 1 (Green): Approximately 0.25 (25%), cumulative proportion ~0.67
* Rating 2 (Red): Approximately 0.15 (15%), cumulative proportion ~0.82
* Rating 3 (Purple): Approximately 0.08 (8%), cumulative proportion ~0.90
* Rating 4 (Yellow): Approximately 0.10 (10%), cumulative proportion ~1.00
* **Qwen2.5-0.5B-Instruct-v0.1:**
* Rating 0 (Blue): Approximately 0.40 (40%)
* Rating 1 (Green): Approximately 0.25 (25%), cumulative proportion ~0.65
* Rating 2 (Red): Approximately 0.15 (15%), cumulative proportion ~0.80
* Rating 3 (Purple): Approximately 0.08 (8%), cumulative proportion ~0.88
* Rating 4 (Yellow): Approximately 0.12 (12%), cumulative proportion ~1.00
* **Qwen2.5-2B-Instruct:**
* Rating 0 (Blue): Approximately 0.70 (70%)
* Rating 1 (Green): Approximately 0.15 (15%), cumulative proportion ~0.85
* Rating 2 (Red): Approximately 0.05 (5%), cumulative proportion ~0.90
* Rating 3 (Purple): Approximately 0.03 (3%), cumulative proportion ~0.93
* Rating 4 (Yellow): Approximately 0.07 (7%), cumulative proportion ~1.00
* **Qwen2.5-5.3B-Instruct:**
* Rating 0 (Blue): Approximately 0.65 (65%)
* Rating 1 (Green): Approximately 0.15 (15%), cumulative proportion ~0.80
* Rating 2 (Red): Approximately 0.08 (8%), cumulative proportion ~0.88
* Rating 3 (Purple): Approximately 0.05 (5%), cumulative proportion ~0.93
* Rating 4 (Yellow): Approximately 0.07 (7%), cumulative proportion ~1.00
* **Qwen2.5-72B-Instruct:**
* Rating 0 (Blue): Approximately 0.58 (58%)
* Rating 1 (Green): Approximately 0.18 (18%), cumulative proportion ~0.76
* Rating 2 (Red): Approximately 0.10 (10%), cumulative proportion ~0.86
* Rating 3 (Purple): Approximately 0.06 (6%), cumulative proportion ~0.92
* Rating 4 (Yellow): Approximately 0.08 (8%), cumulative proportion ~1.00
* **claude-3-haiku-20240307:**
* Rating 0 (Blue): Approximately 0.75 (75%)
* Rating 1 (Green): Approximately 0.10 (10%), cumulative proportion ~0.85
* Rating 2 (Red): Approximately 0.05 (5%), cumulative proportion ~0.90
* Rating 3 (Purple): Approximately 0.03 (3%), cumulative proportion ~0.93
* Rating 4 (Yellow): Approximately 0.07 (7%), cumulative proportion ~1.00
* **claude-3-sonnet-20240229:**
* Rating 0 (Blue): Approximately 0.60 (60%)
* Rating 1 (Green): Approximately 0.15 (15%), cumulative proportion ~0.75
* Rating 2 (Red): Approximately 0.10 (10%), cumulative proportion ~0.85
* Rating 3 (Purple): Approximately 0.05 (5%), cumulative proportion ~0.90
* Rating 4 (Yellow): Approximately 0.10 (10%), cumulative proportion ~1.00
* **gpt-4o-20240513:**
* Rating 0 (Blue): Approximately 0.58 (58%)
* Rating 1 (Green): Approximately 0.18 (18%), cumulative proportion ~0.76
* Rating 2 (Red): Approximately 0.10 (10%), cumulative proportion ~0.86
* Rating 3 (Purple): Approximately 0.05 (5%), cumulative proportion ~0.91
* Rating 4 (Yellow): Approximately 0.09 (9%), cumulative proportion ~1.00
* **gpt-4o-mini-2024-07-18:**
* Rating 0 (Blue): Approximately 0.55 (55%)
* Rating 1 (Green): Approximately 0.20 (20%), cumulative proportion ~0.75
* Rating 2 (Red): Approximately 0.10 (10%), cumulative proportion ~0.85
* Rating 3 (Purple): Approximately 0.05 (5%), cumulative proportion ~0.90
* Rating 4 (Yellow): Approximately 0.10 (10%), cumulative proportion ~1.00
### Key Observations
* **Dominance of Rating 0:** Most models show a significant proportion of Rating 0 responses, indicating that the lowest rating is the most frequent outcome for many of them.
* **Llama 3.1 Small Models:** The Llama 3.1 8B, 3.2-1B, and 3.2-3B Instruct models exhibit an extremely high proportion of Rating 0 (around 98%) with very little distribution across other ratings. This suggests a consistent, low-quality output or a specific failure mode for these models in this evaluation.
* **Qwen2.5 Models:** The Qwen2.5 models (0.5B, 2B, 5.3B, 72B) show a relatively consistent distribution pattern, with Rating 0 being the largest segment, followed by Rating 1, and then smaller proportions for Ratings 2, 3, and 4. The 72B model has a slightly higher proportion of higher ratings (1-4) compared to its smaller counterparts.
* **Claude Models:** Both Claude models (Haiku and Sonnet) show a substantial proportion of Rating 0, but also a more distributed pattern for higher ratings compared to the Llama small models. Claude-3-haiku-20240307 has a higher proportion of Rating 0 than Claude-3-sonnet-20240229.
* **GPT-4o Models:** The two GPT-4o models (gpt-4o-20240513 and gpt-4o-mini-2024-07-18) have similar rating distributions, with Rating 0 being the largest segment, followed by Rating 1, and then a noticeable presence of Ratings 2 and 4.
* **Mistral Models:** Mistral-7B-Instruct has a higher proportion of Rating 0 than Mistral-8x22B-Instruct-v0.1. The 8x22B model shows a more even distribution across ratings 0, 1, and 2, with a smaller but present proportion of 3 and 4.
### Interpretation
This stacked bar chart provides a comparative view of how different language models perform when evaluated by a specific instance of Claude 3.5 Sonnet. The prevalence of Rating 0 across most models suggests that the evaluation criteria or the nature of the tasks might be challenging, leading to frequent low scores.
The extreme concentration of Rating 0 for the smaller Llama 3.1 models is a significant finding. It implies that these specific versions might be highly prone to errors or not well-suited for the evaluated tasks. In contrast, models like the Qwen2.5 series and the GPT-4o variants show a more nuanced distribution, indicating a broader range of performance rather than a consistent failure.
The presence of higher ratings (1-4) in varying degrees across models suggests that some models are more capable of producing satisfactory or even excellent outputs. The evaluator's specific version ("claude-3-5-sonnet-20241022") is crucial context, as different evaluators or even different versions of the same model could yield different results. The chart allows for a direct comparison of these models' "rating profiles" under identical evaluation conditions. The data suggests that while many models struggle with consistently high ratings, there are clear differences in their ability to avoid the lowest rating and achieve better scores.
DECODING INTELLIGENCE...