## Heatmap: Needle in a Haystack Evaluation
### Overview
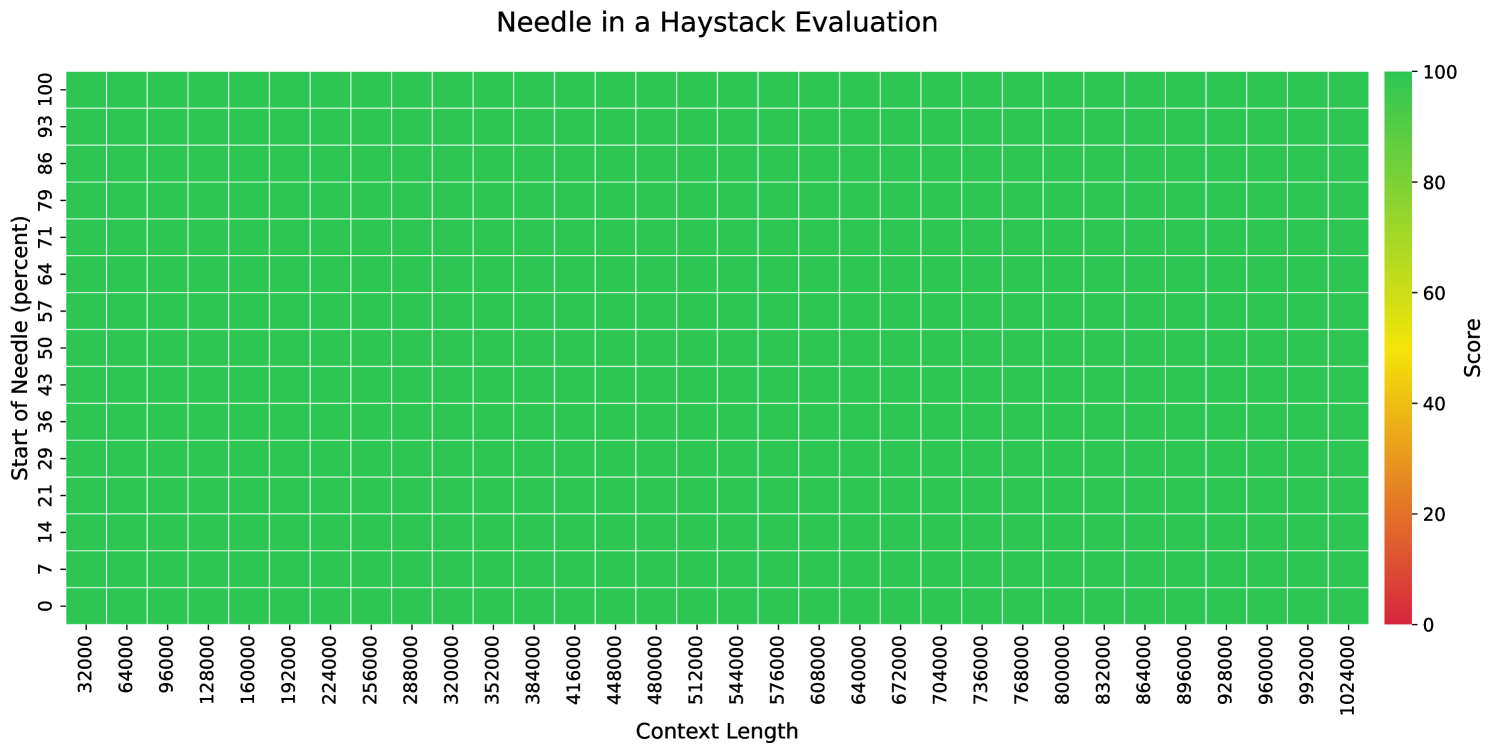
The image displays a heatmap titled "Needle in a Haystack Evaluation," visualizing scores across two dimensions: "Context Length" (x-axis) and "Start of Needle (percent)" (y-axis). The color gradient ranges from red (low scores) to green (high scores), with all cells uniformly green, indicating maximum scores.
### Components/Axes
- **X-axis (Context Length)**: Labeled "Context Length," with values ranging from 0 to 1,024,000 in increments of 32,000 (e.g., 0, 32,000, 64,000, ..., 1,024,000).
- **Y-axis (Start of Needle)**: Labeled "Start of Needle (percent)," with values from 0 to 100 in increments of 1.
- **Legend**: Positioned on the right, showing a gradient from red (0) to green (100), with no intermediate values visible.
- **Grid**: White grid lines separate cells, with no annotations or numerical labels within cells.
### Detailed Analysis
- **Data Distribution**: Every cell in the heatmap is filled with a solid green color, corresponding to a score of 100%.
- **Axis Ranges**:
- Context Length spans 0–1,024,000 (32,000 increments).
- Start of Needle spans 0–100% (1% increments).
- **Color Consistency**: No red or yellow cells are present, confirming uniform maximum scores.
### Key Observations
1. **Uniform Scores**: All combinations of context length and needle start position yield a score of 100%.
2. **No Variability**: No discernible patterns, trends, or outliers exist in the data.
3. **Axis Coverage**: The x-axis covers a wide range of context lengths, while the y-axis spans the full percentage scale.
### Interpretation
The data suggests that the evaluation metric being tested (likely related to locating a "needle in a haystack") consistently achieves perfect scores across all tested parameters. This could indicate:
- A non-discriminative evaluation setup where all inputs are trivially solvable.
- A flaw in the metric design, failing to differentiate between varying difficulty levels.
- A controlled test environment where outcomes are intentionally uniform.
The absence of variability implies the metric may lack sensitivity to contextual complexity or needle placement, warranting further investigation into its validity for real-world applications.