## Line Chart: I-Don't-Know Rate vs. Layer for Llama Models
### Overview
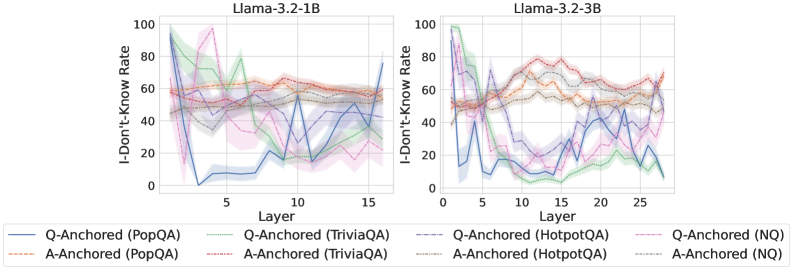
The image presents two line charts comparing the "I-Don't-Know Rate" across different layers of two Llama models (Llama-3.2-1B and Llama-3.2-3B). Each chart displays the rate for various question-answering datasets, anchored either by question (Q-Anchored) or answer (A-Anchored). The x-axis represents the layer number, and the y-axis represents the I-Don't-Know Rate, ranging from 0 to 100.
### Components/Axes
* **Titles:**
* Left Chart: "Llama-3.2-1B"
* Right Chart: "Llama-3.2-3B"
* **Y-Axis:** "I-Don't-Know Rate" (ranging from 0 to 100, with markers at 0, 20, 40, 60, 80, and 100)
* **X-Axis:** "Layer"
* Left Chart: Layer numbers from 0 to 15, with markers at 0, 5, 10, and 15.
* Right Chart: Layer numbers from 0 to 25, with markers at 0, 5, 10, 15, 20, and 25.
* **Legend:** Located at the bottom of the image, describing the lines:
* Blue: Q-Anchored (PopQA)
* Brown dashed: A-Anchored (PopQA)
* Green dotted: Q-Anchored (TriviaQA)
* Pink dashed: A-Anchored (TriviaQA)
* Red dashed: Q-Anchored (NQ)
* Gray dotted: A-Anchored (NQ)
* Purple dashed: Q-Anchored (HotpotQA)
* Orange dashed: A-Anchored (HotpotQA)
### Detailed Analysis
**Left Chart: Llama-3.2-1B**
* **Q-Anchored (PopQA) (Blue):** Starts at approximately 60, drops sharply to near 0 around layer 3, then fluctuates between 0 and 20 until the end.
* **A-Anchored (PopQA) (Brown dashed):** Starts around 60, remains relatively stable between 55 and 65 across all layers.
* **Q-Anchored (TriviaQA) (Green dotted):** Starts around 90, drops to approximately 60 by layer 2, fluctuates between 60 and 80.
* **A-Anchored (TriviaQA) (Pink dashed):** Starts around 60, drops to approximately 40 by layer 2, fluctuates between 30 and 60.
* **Q-Anchored (NQ) (Red dashed):** Starts around 50, fluctuates between 40 and 60.
* **A-Anchored (NQ) (Gray dotted):** Starts around 50, fluctuates between 30 and 60.
* **Q-Anchored (HotpotQA) (Purple dashed):** Starts around 80, drops to approximately 20 by layer 3, fluctuates between 20 and 60.
* **A-Anchored (HotpotQA) (Orange dashed):** Starts around 50, remains relatively stable between 50 and 70 across all layers.
**Right Chart: Llama-3.2-3B**
* **Q-Anchored (PopQA) (Blue):** Starts at approximately 50, drops sharply to near 10 around layer 4, then fluctuates between 10 and 50 until the end.
* **A-Anchored (PopQA) (Brown dashed):** Starts around 50, rises to approximately 70 by layer 10, then remains relatively stable between 60 and 70 across all layers.
* **Q-Anchored (TriviaQA) (Green dotted):** Starts around 90, drops to approximately 10 by layer 4, fluctuates between 10 and 40.
* **A-Anchored (TriviaQA) (Pink dashed):** Starts around 50, drops to approximately 10 by layer 4, fluctuates between 10 and 40.
* **Q-Anchored (NQ) (Red dashed):** Starts around 50, rises to approximately 80 by layer 10, then remains relatively stable between 70 and 80 across all layers.
* **A-Anchored (NQ) (Gray dotted):** Starts around 50, fluctuates between 40 and 60.
* **Q-Anchored (HotpotQA) (Purple dashed):** Starts around 100, drops to approximately 20 by layer 4, fluctuates between 20 and 50.
* **A-Anchored (HotpotQA) (Orange dashed):** Starts around 50, rises to approximately 80 by layer 10, then remains relatively stable between 70 and 80 across all layers.
### Key Observations
* For both models, the "I-Don't-Know Rate" varies significantly depending on the dataset and whether the anchoring is done by question or answer.
* The Q-Anchored (PopQA) line shows a dramatic drop in the "I-Don't-Know Rate" in the initial layers for both models.
* The A-Anchored (PopQA) line remains relatively stable across all layers for both models.
* The Q-Anchored (TriviaQA) and A-Anchored (TriviaQA) lines show a dramatic drop in the "I-Don't-Know Rate" in the initial layers for the Llama-3.2-3B model.
* The Q-Anchored (HotpotQA) line shows a dramatic drop in the "I-Don't-Know Rate" in the initial layers for both models.
* The A-Anchored (HotpotQA) line rises in the initial layers for the Llama-3.2-3B model.
### Interpretation
The charts illustrate how the "I-Don't-Know Rate" changes across different layers of the Llama models when processing various question-answering datasets. The differences between Q-Anchored and A-Anchored rates suggest that the model's confidence varies depending on whether the question or the answer is used as the anchor. The initial drop in the "I-Don't-Know Rate" for certain datasets (PopQA, TriviaQA, HotpotQA) in the early layers indicates that the model quickly gains confidence or learns to provide answers for those specific types of questions. The stability of the A-Anchored (PopQA) line suggests a consistent level of uncertainty when the answer is used as the anchor for the PopQA dataset. The Llama-3.2-3B model shows a more pronounced drop in the "I-Don't-Know Rate" for TriviaQA and HotpotQA, indicating that it may be better at processing these types of questions compared to Llama-3.2-1B.