\n
## Diagram: Directed Acyclic Graph (DAG)
### Overview
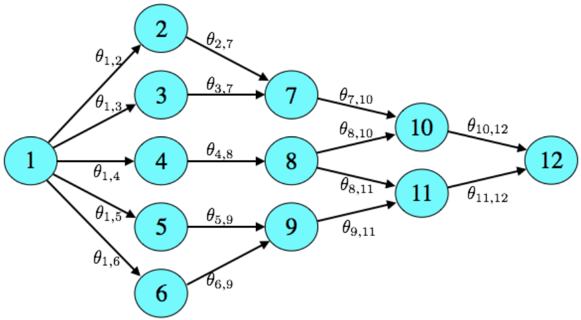
The image depicts a directed acyclic graph (DAG) consisting of 12 nodes, numbered 1 through 12, connected by directed edges. Each edge is labeled with a theta value (θ), representing a parameter or weight associated with the connection. The graph appears to represent a sequence of dependencies or a probabilistic model.
### Components/Axes
The diagram consists of:
* **Nodes:** 12 circular nodes labeled 1 to 12.
* **Edges:** Directed arrows connecting the nodes.
* **Edge Labels:** Each edge is labeled with a theta value (θ) in the format θ<sub>i,j</sub>, where 'i' is the source node and 'j' is the destination node.
### Detailed Analysis or Content Details
The graph's structure and edge labels are as follows:
* Node 1 has outgoing edges to nodes 2, 3, 4, 5, and 6.
* Edge 1 -> 2: θ<sub>1,2</sub>
* Edge 1 -> 3: θ<sub>1,3</sub>
* Edge 1 -> 4: θ<sub>1,4</sub>
* Edge 1 -> 5: θ<sub>1,5</sub>
* Edge 1 -> 6: θ<sub>1,6</sub>
* Node 2 has an outgoing edge to node 7.
* Edge 2 -> 7: θ<sub>2,7</sub>
* Node 3 has an outgoing edge to node 7.
* Edge 3 -> 7: θ<sub>3,7</sub>
* Node 4 has an outgoing edge to node 8.
* Edge 4 -> 8: θ<sub>4,8</sub>
* Node 5 has an outgoing edge to node 9.
* Edge 5 -> 9: θ<sub>5,9</sub>
* Node 6 has an outgoing edge to node 9.
* Edge 6 -> 9: θ<sub>6,9</sub>
* Node 7 has an outgoing edge to node 10.
* Edge 7 -> 10: θ<sub>7,10</sub>
* Node 8 has outgoing edges to nodes 10 and 11.
* Edge 8 -> 10: θ<sub>8,10</sub>
* Edge 8 -> 11: θ<sub>8,11</sub>
* Node 9 has an outgoing edge to node 11.
* Edge 9 -> 11: θ<sub>9,11</sub>
* Node 10 has an outgoing edge to node 12.
* Edge 10 -> 12: θ<sub>10,12</sub>
* Node 11 has an outgoing edge to node 12.
* Edge 11 -> 12: θ<sub>11,12</sub>
### Key Observations
The graph is a DAG, meaning there are no cycles. Node 1 is the root node, and Node 12 is the terminal node. The graph represents a branching structure where information or probability flows from Node 1 to Node 12 through various paths. The theta values represent the strength or weight of each connection.
### Interpretation
This diagram likely represents a Bayesian network or a similar probabilistic graphical model. The nodes represent random variables, and the edges represent conditional dependencies between them. The theta values (θ<sub>i,j</sub>) could represent conditional probabilities or weights in a machine learning model. The structure suggests that the state of Node 1 influences the states of all other nodes, and the final state is represented by Node 12. The branching structure allows for multiple paths from Node 1 to Node 12, indicating that Node 12's state is influenced by multiple factors. Without knowing the specific context, it's difficult to determine the exact meaning of the nodes and edges, but the diagram provides a clear visual representation of a complex dependency structure. The diagram is a visual representation of a system where the value of a node is dependent on the values of its predecessors.