## Line Chart: Qwen3-32B Performance Analysis
### Overview
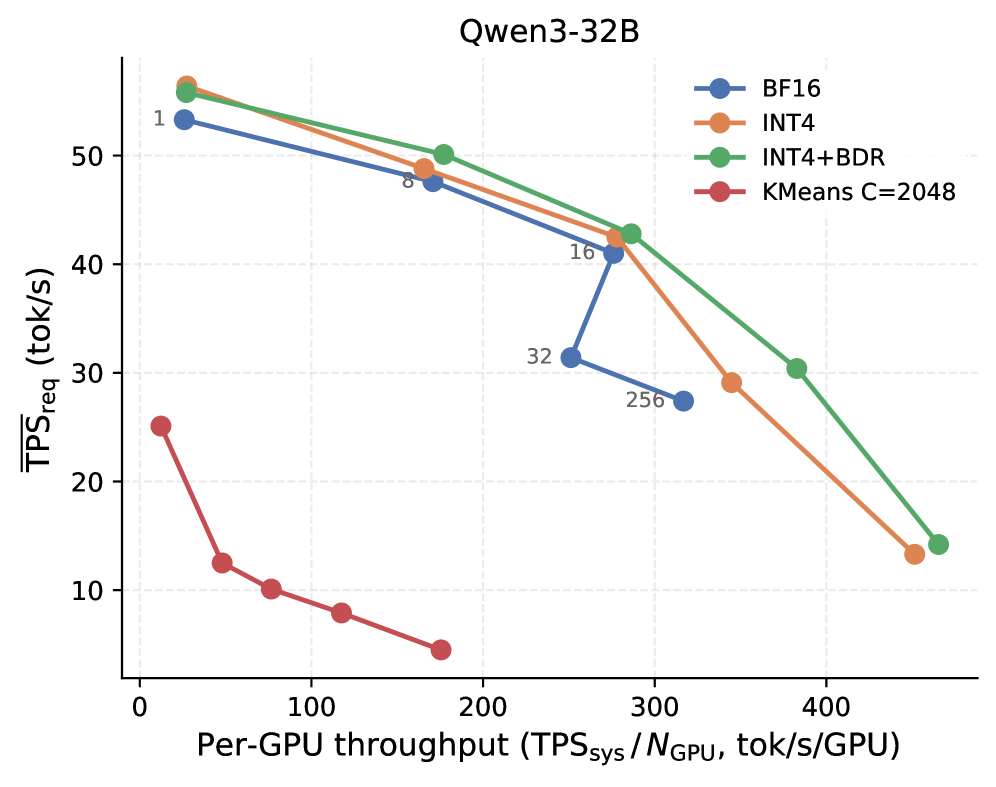
The chart compares the performance of four configurations (BF16, INT4, INT4+BDR, KMeans C=2048) in terms of required tokens per second (TPS_req) against per-GPU throughput (TPS_sys/N_GPU). The y-axis represents TPS_req (tok/s), while the x-axis represents normalized throughput (TPS_sys/N_GPU, tok/s/GPU). Data points are plotted with distinct colors and labeled with approximate values.
### Components/Axes
- **Y-axis**: TPS_req (tok/s) ranging from 0 to 60 in increments of 10.
- **X-axis**: Per-GPU throughput (TPS_sys/N_GPU, tok/s/GPU) ranging from 0 to 500 in increments of 100.
- **Legend**:
- Blue: BF16
- Orange: INT4
- Green: INT4+BDR
- Red: KMeans C=2048
- **Legend Placement**: Top-right corner.
### Detailed Analysis
1. **BF16 (Blue Line)**:
- Starts at ~55 tok/s at x=0.
- Decreases steadily to ~25 tok/s at x=500.
- Data points: 1 (55), 8 (50), 16 (45), 32 (35), 256 (25).
2. **INT4 (Orange Line)**:
- Begins at ~58 tok/s at x=0.
- Declines to ~15 tok/s at x=500.
- Data points: 1 (58), 8 (50), 16 (45), 32 (35), 256 (25), 456 (15).
3. **INT4+BDR (Green Line)**:
- Starts at ~57 tok/s at x=0.
- Drops to ~14 tok/s at x=500.
- Data points: 1 (57), 8 (50), 16 (45), 32 (35), 256 (25), 456 (15), 512 (14).
4. **KMeans C=2048 (Red Line)**:
- Linear decline from ~25 tok/s at x=0 to ~5 tok/s at x=200.
- No data points beyond x=200.
- Data points: 1 (25), 8 (20), 16 (15), 32 (10), 256 (5).
### Key Observations
- **INT4+BDR** consistently outperforms other configurations across all throughput levels, maintaining the highest TPS_req.
- **KMeans C=2048** shows a linear relationship, suggesting a fixed efficiency threshold.
- **BF16** and **INT4** exhibit similar trends but diverge at higher throughputs (x > 300).
- **INT4+BDR** demonstrates the most stable performance, with minimal deviation between data points.
### Interpretation
The chart highlights the trade-off between computational efficiency and token processing speed. **INT4+BDR** achieves the highest TPS_req, indicating superior optimization for high-throughput scenarios. **KMeans C=2048**'s linear decline suggests it is less adaptable to varying workloads. The divergence between BF16 and INT4 at higher throughputs implies architectural differences in handling parallelism. Notably, the green line (INT4+BDR) maintains a consistent lead, suggesting it is the most robust configuration for scaling. The absence of data beyond x=200 for KMeans may indicate a performance ceiling or experimental limitation.