\n
## Histograms: Reflection Frequency vs. Number of Blanks
### Overview
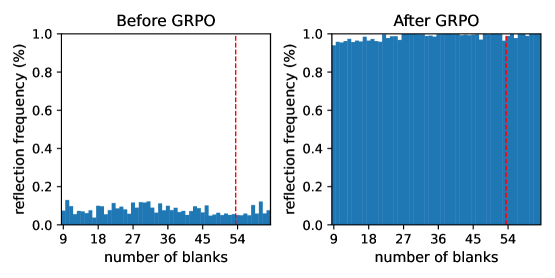
The image presents two histograms, side-by-side, comparing the distribution of "reflection frequency" against the "number of blanks" before and after a process labeled "GRPO". Both histograms share the same x and y axes scales. A vertical dashed red line is present in both histograms, marking a value of approximately 54 on the x-axis.
### Components/Axes
* **X-axis Label:** "number of blanks" (ranging from approximately 9 to 54)
* **Y-axis Label:** "reflection frequency (%)" (ranging from 0.0 to 1.0)
* **Title (Left Histogram):** "Before GRPO"
* **Title (Right Histogram):** "After GRPO"
* **Vertical Dashed Red Line:** Present in both histograms, positioned at approximately x = 54.
* **Data Series:** Each histogram represents a single data series, showing the frequency distribution.
### Detailed Analysis or Content Details
**Left Histogram (Before GRPO):**
* **Trend:** The histogram shows a relatively flat distribution with low reflection frequencies across most of the "number of blanks" range. There is a slight increase in frequency around the 9-18 range, and a small peak around 45. The most significant feature is a sharp increase in reflection frequency at and beyond approximately 54 blanks, indicated by the vertical dashed line.
* **Approximate Data Points:**
* 9-18 blanks: Reflection frequency ~ 0.05 - 0.1
* 18-27 blanks: Reflection frequency ~ 0.02 - 0.06
* 27-36 blanks: Reflection frequency ~ 0.01 - 0.04
* 36-45 blanks: Reflection frequency ~ 0.01 - 0.03
* 45-54 blanks: Reflection frequency ~ 0.02 - 0.15
* 54+ blanks: Reflection frequency ~ 0.15 - 0.3 (increasing rapidly)
**Right Histogram (After GRPO):**
* **Trend:** The histogram shows a very different distribution. The reflection frequency is consistently high (close to 1.0) for most values of "number of blanks". There is a slight decrease in frequency around the 54 blanks mark, but it remains significantly higher than in the "Before GRPO" histogram.
* **Approximate Data Points:**
* 9-18 blanks: Reflection frequency ~ 0.95 - 1.0
* 18-27 blanks: Reflection frequency ~ 0.9 - 1.0
* 27-36 blanks: Reflection frequency ~ 0.85 - 1.0
* 36-45 blanks: Reflection frequency ~ 0.8 - 1.0
* 45-54 blanks: Reflection frequency ~ 0.8 - 0.95
* 54+ blanks: Reflection frequency ~ 0.7 - 0.9 (slight decrease)
### Key Observations
* The "GRPO" process appears to have dramatically altered the distribution of reflection frequency.
* Before GRPO, high reflection frequencies were only observed for a small subset of samples with a large number of blanks (>= 54).
* After GRPO, high reflection frequencies are observed across almost all values of "number of blanks".
* The vertical dashed line at 54 appears to be a threshold or cutoff point, with a significant change in behavior around this value.
### Interpretation
The data suggests that the "GRPO" process has effectively increased the reflection frequency for samples with a lower "number of blanks". Before GRPO, only samples with a high number of blanks exhibited significant reflection. After GRPO, the reflection is consistent across a wider range of blank counts. This could indicate that GRPO is improving the quality or effectiveness of the reflection process, making it less dependent on the number of blanks. The sharp change at the 54 blank mark before GRPO might represent a critical threshold for the original process, which GRPO has mitigated. The histograms demonstrate a clear shift in the distribution of reflection frequency, indicating a positive impact of the GRPO process.