## Line Chart: Model Performance Across Three Benchmarks
### Overview
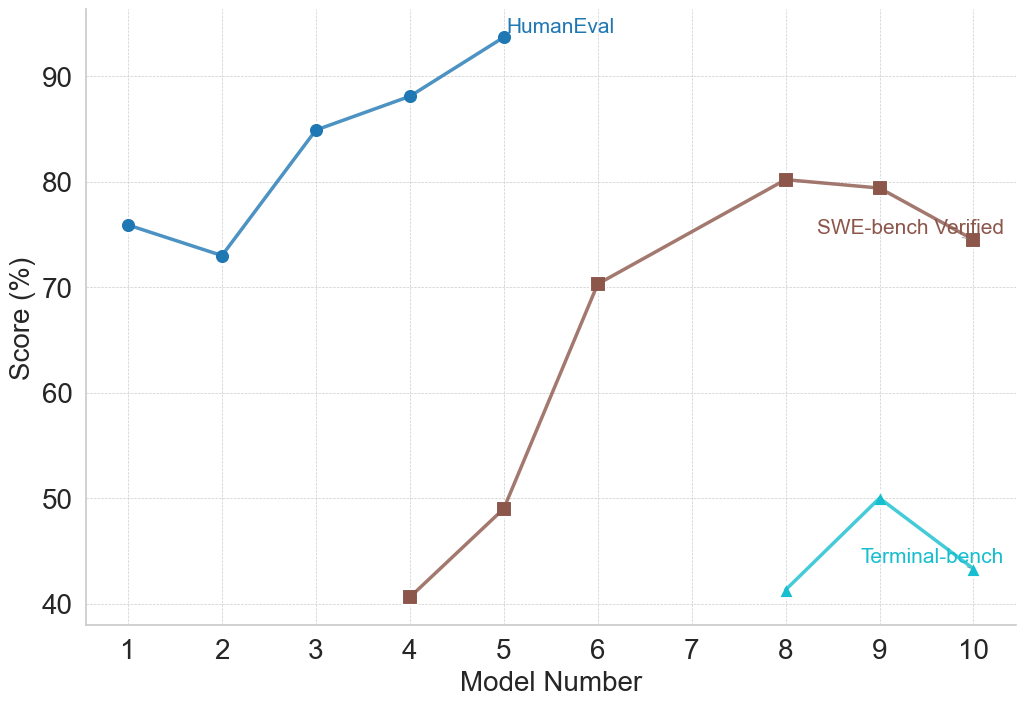
This image is a line chart comparing the performance scores (in percentage) of ten different models (labeled 1 through 10) on three distinct evaluation benchmarks: HumanEval, SWE-bench Verified, and Terminal-bench. The chart visualizes how model capabilities vary across these different testing domains.
### Components/Axes
* **X-Axis:** Labeled "Model Number". It has discrete integer markers from 1 to 10.
* **Y-Axis:** Labeled "Score (%)". It has a linear scale with major grid lines at intervals of 10%, ranging from 40% to 90%.
* **Legend:** Located in the top-right quadrant of the chart area. It defines three data series:
* **HumanEval:** Blue line with circular markers.
* **SWE-bench Verified:** Brown line with square markers.
* **Terminal-bench:** Cyan (light blue) line with triangular markers.
### Detailed Analysis
**1. HumanEval (Blue Line, Circle Markers)**
* **Trend:** Shows an overall upward trend with a notable dip at Model 2. Performance is consistently the highest among the three benchmarks for the models where data is present.
* **Data Points (Approximate):**
* Model 1: ~76%
* Model 2: ~73% (Dip)
* Model 3: ~85%
* Model 4: ~88%
* Model 5: ~94% (Peak)
* *No data points are plotted for Models 6 through 10.*
**2. SWE-bench Verified (Brown Line, Square Markers)**
* **Trend:** Shows a strong, generally upward trend from Model 4 to Model 8, followed by a slight decline. Data is only present for Models 4, 5, 6, 8, 9, and 10.
* **Data Points (Approximate):**
* Model 4: ~41%
* Model 5: ~49%
* Model 6: ~70%
* Model 7: *No data point.*
* Model 8: ~80% (Peak)
* Model 9: ~79%
* Model 10: ~75%
**3. Terminal-bench (Cyan Line, Triangle Markers)**
* **Trend:** Shows a sharp increase from Model 8 to Model 9, followed by a decrease to Model 10. Data is only present for the last three models.
* **Data Points (Approximate):**
* Models 1-7: *No data points.*
* Model 8: ~41%
* Model 9: ~50% (Peak)
* Model 10: ~43%
### Key Observations
1. **Benchmark Specificity:** Models are not evaluated on all benchmarks. HumanEval data is only for Models 1-5, SWE-bench for Models 4-10 (except 7), and Terminal-bench only for Models 8-10. This suggests the benchmarks may test different skills or were applied to different model generations.
2. **Performance Hierarchy:** For the models where direct comparison is possible (Models 4 and 5), HumanEval scores are significantly higher than SWE-bench Verified scores. For Models 8-10, SWE-bench scores are substantially higher than Terminal-bench scores.
3. **Peak Performance:** Each benchmark's peak score is achieved by a different model: HumanEval peaks at Model 5 (~94%), SWE-bench at Model 8 (~80%), and Terminal-bench at Model 9 (~50%).
4. **Volatility:** The Terminal-bench scores show the most volatility over a short range (a 9-point swing between Models 8 and 10). The SWE-bench scores show a large, steady climb followed by a plateau.
### Interpretation
The chart demonstrates that model performance is highly dependent on the evaluation benchmark. A model excelling in one domain (e.g., HumanEval, likely testing general code generation) does not guarantee proportional success in another (e.g., SWE-bench, likely testing real-world software engineering tasks, or Terminal-bench, likely testing command-line or system-level proficiency).
The staggered appearance of data series suggests a progression in model development or testing focus. Earlier models (1-3) were perhaps only tested on HumanEval. Later models (4 onwards) began to be evaluated on more complex, applied benchmarks like SWE-bench. The most recent models (8-10) are additionally tested on Terminal-bench, indicating an expanding scope of evaluation.
The significant performance gap between benchmarks (e.g., ~94% on HumanEval vs. ~49% on SWE-bench for Model 5) highlights the difference between solving isolated programming problems and performing integrated software engineering tasks. The lower and more volatile scores on Terminal-bench suggest it may be a particularly challenging or nascent evaluation domain. The missing data point for Model 7 on SWE-bench is an anomaly that could indicate a failed evaluation or a model not intended for that benchmark.