\n
## Scatter Plot: Confidence vs. Target Length (High School Microeconomics)
### Overview
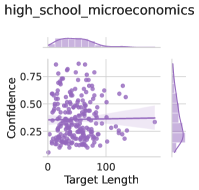
The image presents a scatter plot visualizing the relationship between "Target Length" and "Confidence" for data labeled as "high_school_microeconomics". A density plot is shown above the scatter plot, and a histogram-like visualization is shown to the right of the scatter plot. A regression line with a shaded confidence interval is overlaid on the scatter plot.
### Components/Axes
* **Title:** high\_school\_microeconomics (top-center)
* **X-axis:** Target Length (bottom-center), ranging from approximately 0 to 120.
* **Y-axis:** Confidence (left-center), ranging from approximately 0.15 to 0.75.
* **Scatter Plot:** Purple dots representing individual data points.
* **Regression Line:** A purple line representing the trend of the data.
* **Confidence Interval:** A light purple shaded area around the regression line.
* **Density Plot:** A purple filled area above the scatter plot, showing the distribution of "Target Length".
* **Histogram-like Visualization:** A purple filled area to the right of the scatter plot, showing the distribution of "Confidence".
### Detailed Analysis
The scatter plot shows a weak, potentially negative correlation between "Target Length" and "Confidence". The points are widely dispersed, indicating a high degree of variability.
* **Regression Line Trend:** The regression line is approximately horizontal, indicating a very weak or non-existent linear relationship. It appears to be centered around a confidence value of approximately 0.35.
* **Data Point Distribution:**
* For Target Length values between 0 and 50, Confidence values range from approximately 0.2 to 0.7.
* For Target Length values between 50 and 100, Confidence values are generally lower, ranging from approximately 0.2 to 0.5.
* For Target Length values above 100, Confidence values are concentrated between 0.2 and 0.4.
* **Density Plot:** The density plot shows a peak in the distribution of "Target Length" around a value of approximately 20-30, and a gradual decline as "Target Length" increases.
* **Histogram-like Visualization:** The histogram-like visualization shows a peak in the distribution of "Confidence" around a value of approximately 0.25-0.35.
### Key Observations
* The scatter plot does not show a strong linear relationship between "Target Length" and "Confidence".
* The confidence interval around the regression line is relatively wide, indicating a high degree of uncertainty in the estimated relationship.
* The density plot suggests that shorter "Target Lengths" are more common in the dataset.
* The histogram-like visualization suggests that lower "Confidence" values are more common in the dataset.
### Interpretation
The data suggests that the length of the target does not strongly predict the confidence level in the context of high school microeconomics. The weak correlation and wide confidence interval indicate that other factors likely play a more significant role in determining confidence. The distributions of both "Target Length" and "Confidence" are skewed towards lower values, which could indicate a bias in the data or a natural tendency for shorter targets and lower confidence levels in this domain. The lack of a clear trend suggests that simply increasing the target length does not necessarily lead to increased confidence. Further investigation would be needed to identify the other factors that influence confidence in this context.