## Diagram: Evolution of Step-by-step Construction Heuristics for KP
### Overview
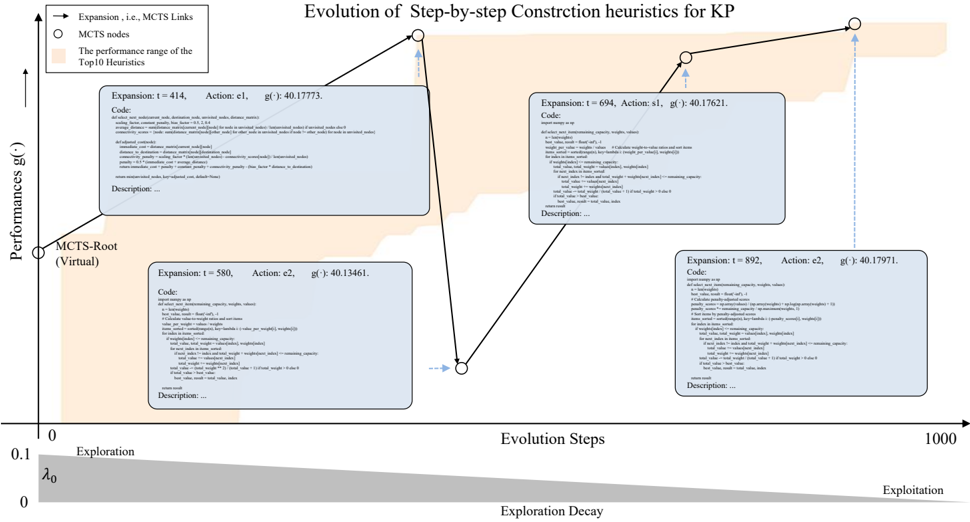
The image presents a diagram illustrating the evolution of step-by-step construction heuristics for a problem denoted as "KP" (likely Knapsack Problem). The diagram visualizes the performance of these heuristics over "Evolution Steps," with a focus on the trade-off between "Exploration" and "Exploitation." The diagram consists of four interconnected nodes representing different stages of heuristic development, linked by arrows indicating the progression of evolution. Each node contains code and a description field.
### Components/Axes
* **Title:** "Evolution of Step-by-step Construction heuristics for KP"
* **X-axis:** "Evolution Steps" ranging from 0 to 1000, labeled with "Exploration" at 0 and "Exploitation" at 1000. A label "Exploration Decay" is present below the axis.
* **Y-axis:** "Performance g( )" ranging from 0 to 1.0, labeled with "λ₀" at 0.1.
* **Legend:**
* Black Arrow: "Expansion, i.e., MCTS Links"
* White Circle: "MCTS nodes"
* **Nodes:** Four rectangular nodes, each containing:
* "Expansion: t = [value], Action: [value], g( ) = [value]"
* "Code:" followed by a block of text.
* "Description..."
### Detailed Analysis or Content Details
The diagram shows four nodes connected by arrows, representing the evolution of heuristics.
**Node 1 (Bottom-Left):**
* Expansion: t = 414, Action: e1, g( ) = 40.17773.
* Code: A block of text starting with "def _init_(self, env, params):" and continuing with several lines of code related to initialization and parameter settings.
* Description: "Description..."
**Node 2 (Bottom-Right):**
* Expansion: t = 580, Action: e2, g( ) = 40.13461.
* Code: A block of text starting with "def _init_(self, env, params):" and continuing with several lines of code, similar to Node 1, but with slight variations.
* Description: "Description..."
**Node 3 (Top-Right):**
* Expansion: t = 694, Action: s1, g( ) = 40.17621.
* Code: A block of text starting with "def _init_(self, env, params):" and continuing with several lines of code, similar to Node 1 and 2.
* Description: "Description..."
**Node 4 (Top-Left):**
* Expansion: t = 892, Action: e2, g( ) = 40.17971.
* Code: A block of text starting with "def _init_(self, env, params):" and continuing with several lines of code, similar to Node 1, 2 and 3.
* Description: "Description..."
The arrows indicate the flow of evolution. The arrow from Node 1 to Node 2 is a curved line. The arrow from Node 2 to Node 3 is a curved line. The arrow from Node 3 to Node 4 is a curved line. There is also a curved arrow connecting Node 4 back to Node 1, suggesting a cyclical or iterative process. The "MCTS-Root (Virtual)" label is positioned near Node 1.
### Key Observations
* The performance values g( ) for all nodes are relatively close, ranging from approximately 40.13 to 40.18.
* The "t" values (Expansion) increase with each step, indicating the progression of evolution.
* The actions taken at each step vary (e1, e2, s1).
* The code within each node appears to be similar, suggesting incremental changes to the heuristic.
* The diagram emphasizes the balance between exploration and exploitation, as represented by the x-axis.
### Interpretation
The diagram illustrates the iterative refinement of construction heuristics for the KP problem using a Monte Carlo Tree Search (MCTS) approach. The nodes represent different versions of the heuristic, and the arrows show how the heuristic evolves over time. The performance metric g( ) indicates the effectiveness of each heuristic. The relatively small differences in g( ) suggest that the evolution process is making incremental improvements. The cyclical arrow from Node 4 to Node 1 implies that the process is ongoing and potentially repeating, allowing for continuous refinement. The "MCTS-Root (Virtual)" label suggests that the initial heuristic is based on a virtual MCTS root, which is then iteratively improved. The code blocks within each node likely represent the implementation of the heuristic, and the "Description..." fields would provide further details about the specific changes made at each step. The diagram highlights the importance of balancing exploration and exploitation in the search for optimal heuristics. The consistent performance values suggest that the algorithm is converging towards a stable solution, but further evolution may be needed to achieve significant improvements.