TECHNICAL ASSET FINGERPRINT
dfa5b52e29c0ea4cc1d47392
Click to view fullscreen
Press ESC or click to close
FOUND IN PAPERS
EXPERT: healer-alpha-free VERSION 1
RUNTIME: free/openrouter/healer-alpha
INTEL_VERIFIED
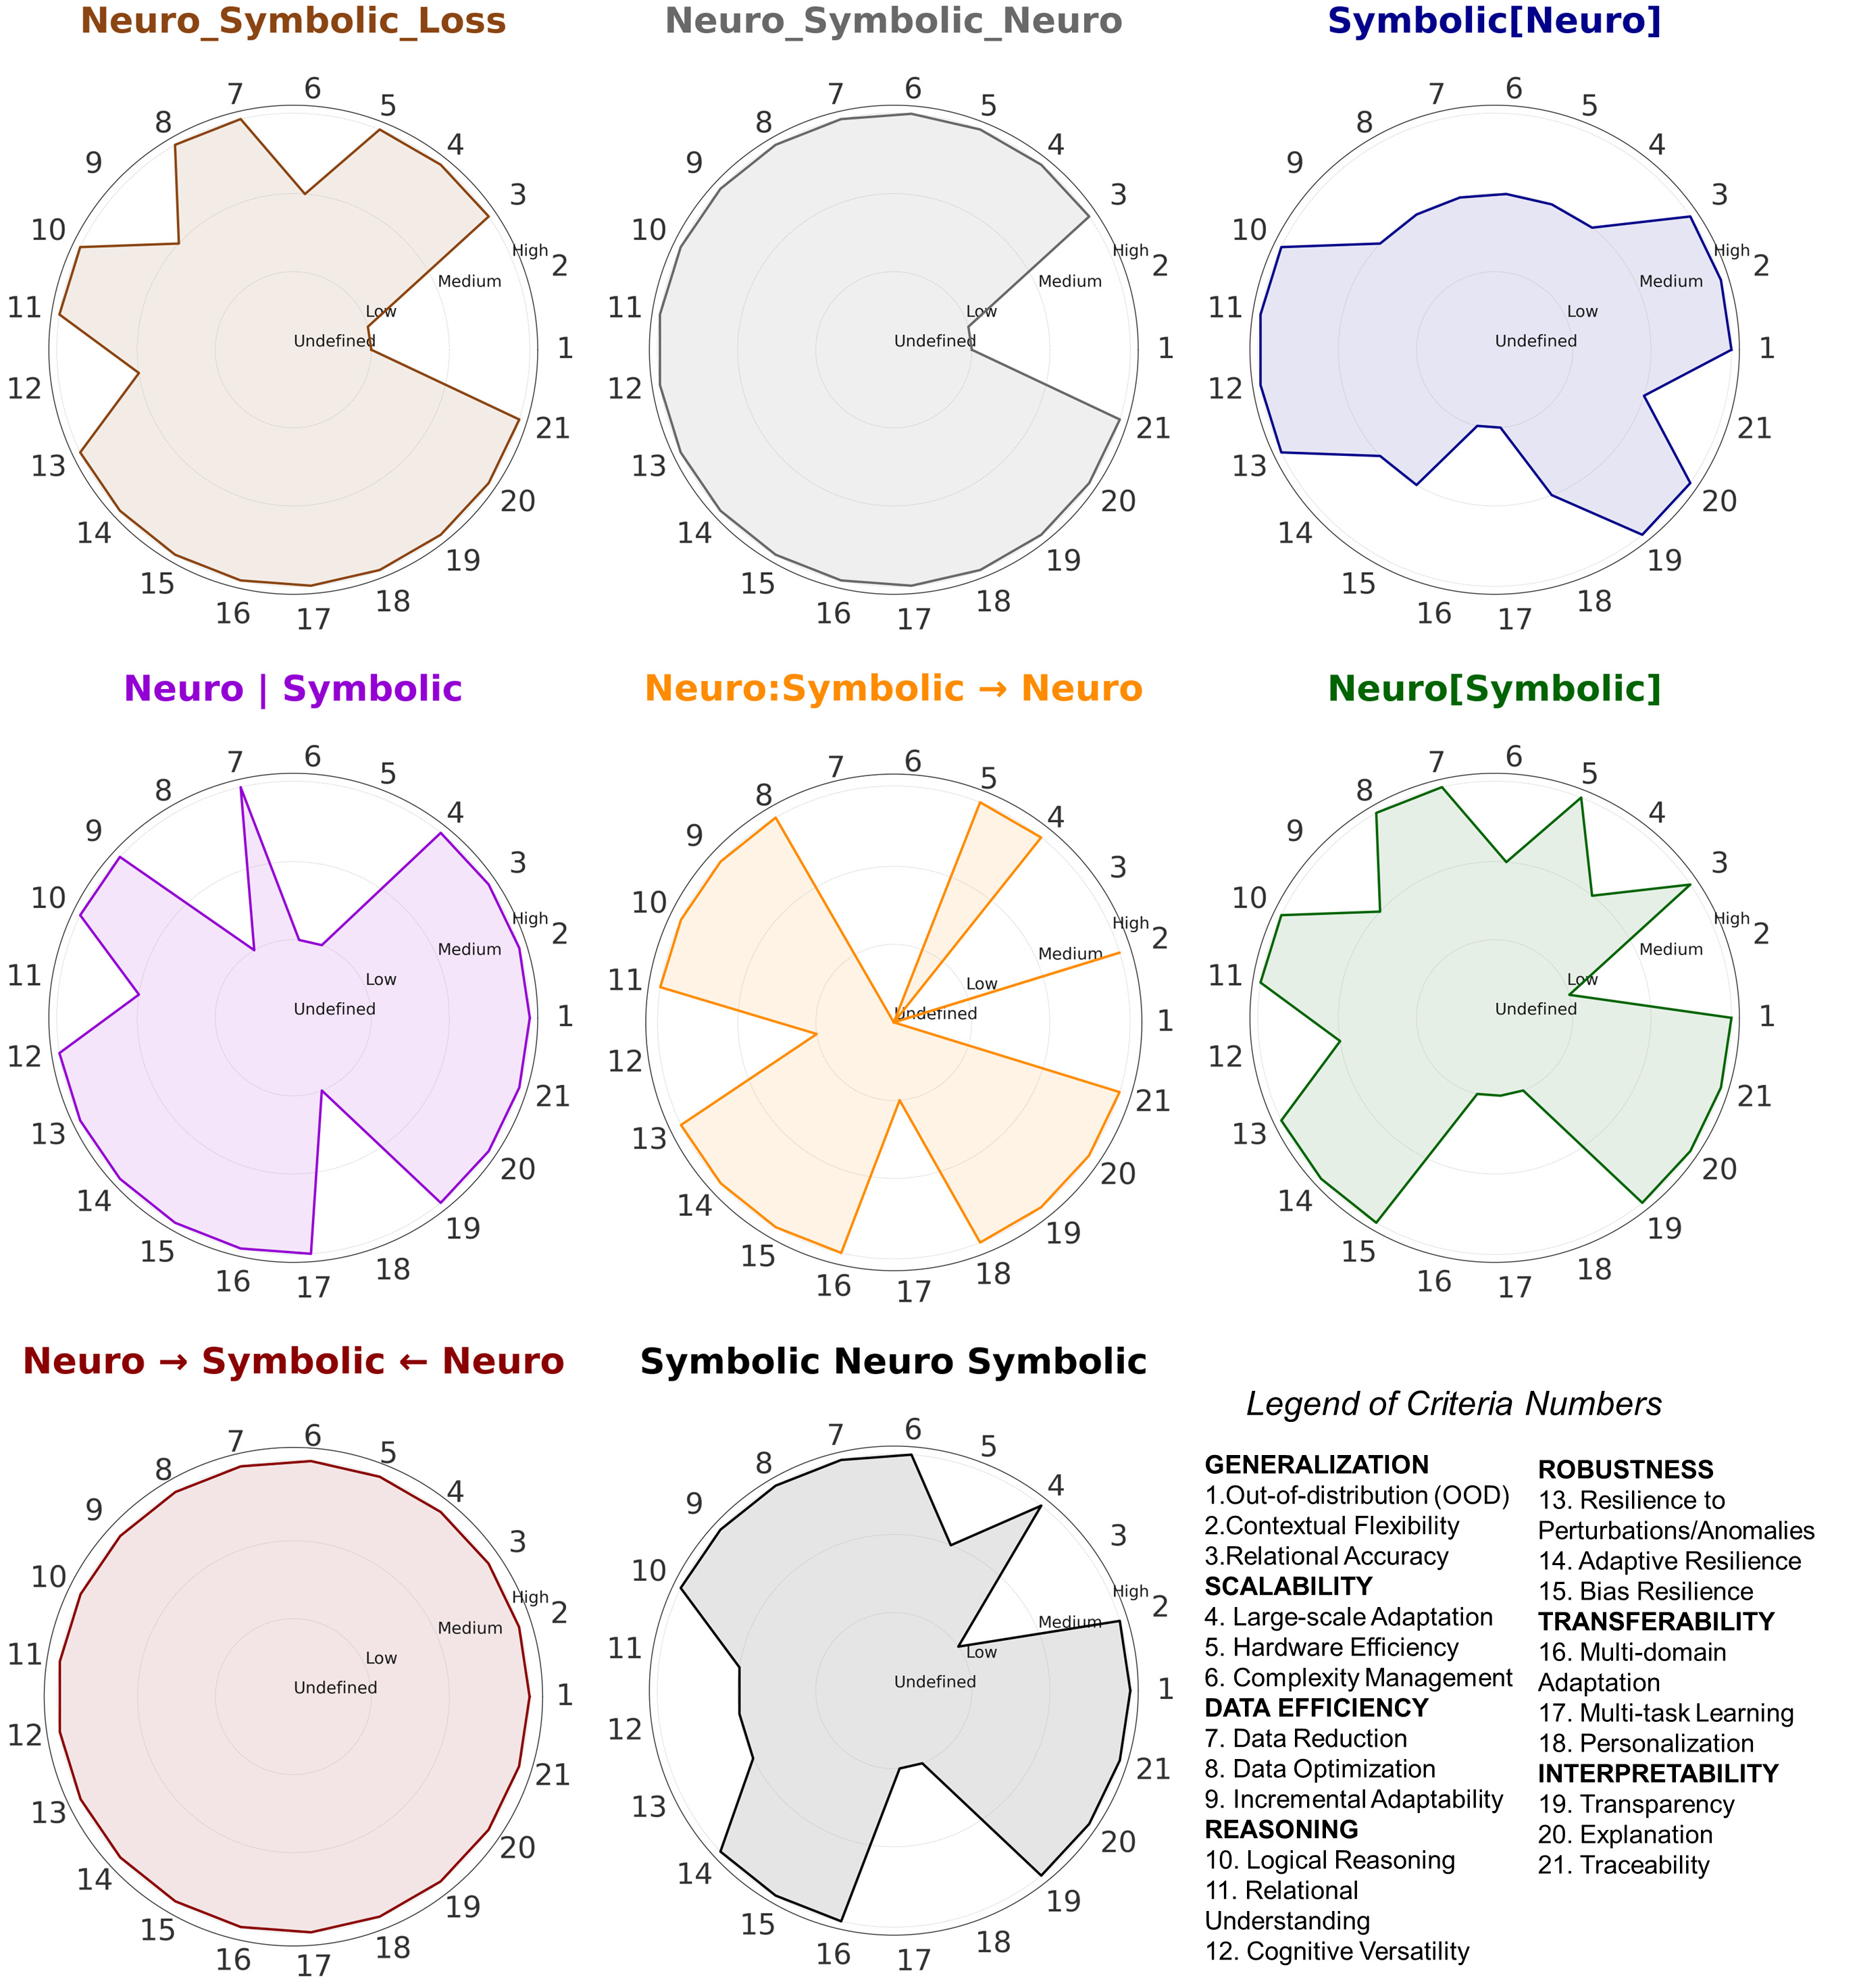
## [Radar Chart Composite]: Neuro-Symbolic AI Architecture Performance Comparison
### Overview
The image displays a 3x3 grid containing eight radar charts (spider charts) and one legend panel. Each radar chart visualizes the performance profile of a distinct neuro-symbolic AI architecture or integration strategy across 21 standardized criteria. The charts use a polar coordinate system where each axis represents a specific criterion, and the radial distance from the center indicates performance level (Undefined, Low, Medium, High). The composite allows for direct visual comparison of the strengths and weaknesses of different neuro-symbolic approaches.
### Components/Axes
**Chart Structure (Common to all 8 charts):**
- **Type:** Radar/Spider Chart
- **Axes:** 21 radial axes, numbered 1 through 21 clockwise, starting from the 3 o'clock position (criterion 1).
- **Radial Scale (from center outward):**
- **Innermost Circle:** Undefined
- **Second Circle:** Low
- **Third Circle:** Medium
- **Outermost Circle:** High
- **Data Representation:** A filled polygon connects the performance values for each of the 21 criteria for a given architecture. The polygon's color corresponds to the architecture's title color.
**Legend of Criteria Numbers (Bottom-Right Panel):**
The legend maps the 21 numbered axes to specific performance criteria, grouped into seven categories:
* **GENERALIZATION**
1. Out-of-distribution (OOD)
2. Contextual Flexibility
3. Relational Accuracy
* **SCALABILITY**
4. Large-scale Adaptation
5. Hardware Efficiency
6. Complexity Management
* **DATA EFFICIENCY**
7. Data Reduction
8. Data Optimization
9. Incremental Adaptability
* **REASONING**
10. Logical Reasoning
11. Relational Understanding
12. Cognitive Versatility
* **ROBUSTNESS**
13. Resilience to Perturbations/Anomalies
14. Adaptive Resilience
15. Bias Resilience
* **TRANSFERABILITY**
16. Multi-domain Adaptation
17. Multi-task Learning
18. Personalization
* **INTERPRETABILITY**
19. Transparency
20. Explanation
21. Traceability
**Individual Chart Titles & Colors:**
1. **Top-Left:** `Neuro_Symbolic_Loss` (Brown)
2. **Top-Center:** `Neuro_Symbolic_Neuro` (Gray)
3. **Top-Right:** `Symbolic[Neuro]` (Blue)
4. **Middle-Left:** `Neuro | Symbolic` (Purple)
5. **Middle-Center:** `Neuro:Symbolic → Neuro` (Orange)
6. **Middle-Right:** `Neuro[Symbolic]` (Green)
7. **Bottom-Left:** `Neuro → Symbolic ← Neuro` (Red)
8. **Bottom-Center:** `Symbolic Neuro Symbolic` (Black)
### Detailed Analysis
**Trend Verification & Data Point Extraction (Approximate Values):**
* **Neuro_Symbolic_Loss (Brown):** Polygon shows strong performance (High) in Data Efficiency (7-9) and Reasoning (10-12). It dips to Medium in Generalization (1-3) and Scalability (4-6), and shows lower performance (Low to Medium) in Robustness (13-15) and Interpretability (19-21).
* **Neuro_Symbolic_Neuro (Gray):** This chart shows the weakest overall profile. Most criteria are at the Low or Medium level. The polygon is closest to the center, indicating poor performance across nearly all categories, with no clear peaks.
* **Symbolic[Neuro] (Blue):** Shows a balanced, moderate profile. Performance is generally Medium across most criteria, with slight peaks towards Medium-High in Scalability (4-6) and Transferability (16-18). Generalization (1-3) and Interpretability (19-21) are at a solid Medium.
* **Neuro | Symbolic (Purple):** Exhibits a highly irregular, star-like shape. It has pronounced peaks at **Criterion 7 (Data Reduction - High)** and **Criterion 16 (Multi-domain Adaptation - High)**. It also scores High in Logical Reasoning (10). However, it shows significant valleys (Low) in Contextual Flexibility (2), Hardware Efficiency (5), and several Robustness criteria (13-15).
* **Neuro:Symbolic → Neuro (Orange):** Another star-like pattern with distinct peaks. High performance is seen in **Large-scale Adaptation (4)**, **Data Reduction (7)**, **Logical Reasoning (10)**, **Resilience to Perturbations (13)**, **Multi-domain Adaptation (16)**, and **Transparency (19)**. It has notable weaknesses in Relational Accuracy (3), Hardware Efficiency (5), and Explanation (20).
* **Neuro[Symbolic] (Green):** Presents a robust, rounded polygon. It achieves High performance in most criteria, particularly in the lower half of the chart: Robustness (13-15), Transferability (16-18), and Interpretability (19-21). Its lowest points are in the Generalization (1-3) and Scalability (4-6) categories, where it sits at Medium.
* **Neuro → Symbolic ← Neuro (Red):** This chart is a near-perfect circle at the **High** level for all 21 criteria. The polygon touches the outermost ring uniformly, indicating top-tier performance across every measured dimension.
* **Symbolic Neuro Symbolic (Black):** Shows a strong but uneven profile. It scores High in Data Efficiency (7-9), Reasoning (10-12), and Robustness (13-15). However, it has a significant dip in Generalization (1-3), where performance falls to Low/Medium, and a smaller dip in Interpretability (19-21).
### Key Observations
1. **Performance Extremes:** The `Neuro → Symbolic ← Neuro` (Red) architecture is presented as the ideal, excelling in all areas. Conversely, `Neuro_Symbolic_Neuro` (Gray) is depicted as the least effective overall.
2. **Specialization vs. Balance:** Some architectures show specialized strengths (e.g., `Neuro | Symbolic` in Data Reduction and Multi-domain Adaptation), while others like `Neuro[Symbolic]` and `Symbolic[Neuro]` offer more balanced, generalist profiles.
3. **Common Trade-offs:** A recurring pattern is the trade-off between **Generalization/Scalability** and **Interpretability**. Architectures strong in one often show relative weakness in the other (e.g., `Neuro[Symbolic]` is strong in Interpretability but weaker in Generalization).
4. **Category Strengths:** **Data Efficiency** (Criteria 7-9) and **Reasoning** (Criteria 10-12) appear to be areas where many of the depicted architectures achieve High performance. **Generalization** (Criteria 1-3) is a more challenging category for most.
### Interpretation
This composite chart serves as a comparative analysis framework for evaluating neuro-symbolic AI systems. The 21 criteria represent a comprehensive set of desirable properties for advanced AI, moving beyond simple accuracy to include robustness, efficiency, and transparency.
The data suggests that the integration strategy between neural and symbolic components profoundly impacts the system's capabilities. The notation in the titles (e.g., `|`, `→`, `[]`, `:`) likely symbolizes different architectural paradigms (e.g., parallel, sequential, nested, hybrid). The chart argues that a bidirectional, deeply integrated approach (`Neuro → Symbolic ← Neuro`) yields the most comprehensive benefits, potentially by allowing continuous feedback and refinement between the neural (learning) and symbolic (reasoning) modules.
The visualization highlights that there is no "one-size-fits-all" architecture. The choice of neuro-symbolic design should be driven by the specific requirements of the application. For instance, a system needing high transparency for regulatory compliance might prioritize an architecture like `Neuro[Symbolic]`, while one dealing with highly variable data might favor `Neuro | Symbolic` for its strong Data Reduction and Multi-domain Adaptation, despite its other weaknesses. The chart effectively communicates these complex trade-offs in an immediately visualizable format.
DECODING INTELLIGENCE...