TECHNICAL ASSET FINGERPRINT
dfb2b61b2312801b0472f881
Click to view fullscreen
Press ESC or click to close
FOUND IN PAPERS
EXPERT: healer-alpha-free VERSION 1
RUNTIME: free/openrouter/healer-alpha
INTEL_VERIFIED
## Line Chart: Performance of Multiple Algorithms Over Environment Steps
### Overview
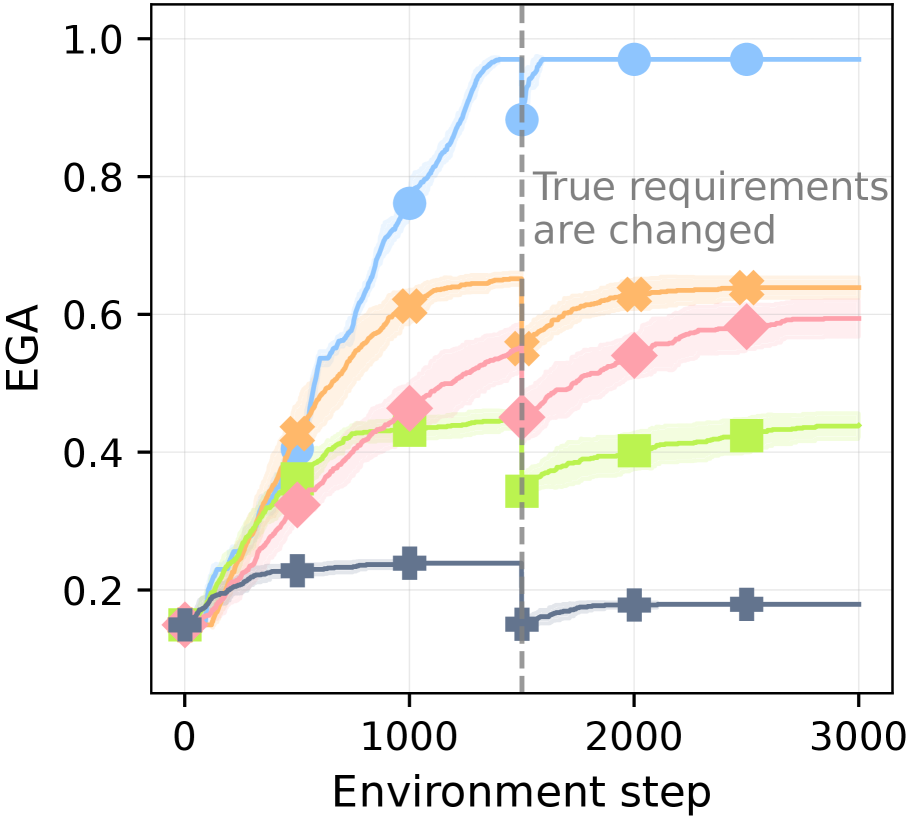
The image is a line chart plotting the performance metric "EGA" against "Environment step" for five distinct algorithms or methods. The chart illustrates how each method's performance evolves over 3000 steps, with a critical intervention point at step 1500 where the "True requirements are changed." The chart includes shaded regions around each line, likely representing confidence intervals or standard deviation across multiple runs.
### Components/Axes
* **X-Axis:** Labeled "Environment step". The scale runs from 0 to 3000, with major tick marks at 0, 1000, 2000, and 3000.
* **Y-Axis:** Labeled "EGA". The scale runs from 0.0 to 1.0, with major tick marks at 0.2, 0.4, 0.6, 0.8, and 1.0.
* **Key Event Marker:** A vertical, gray, dashed line is positioned at Environment step = 1500. To the right of this line, in the upper-right quadrant of the chart, is the annotation text: "True requirements are changed".
* **Data Series (Identified by Color and Marker):**
1. **Light Blue Line with Circle Markers (●):** Top-performing series.
2. **Orange Line with 'X' Markers (✖):** Second-highest performing series.
3. **Pink Line with Diamond Markers (◆):** Middle-performing series.
4. **Light Green Line with Square Markers (■):** Lower-middle performing series.
5. **Dark Gray Line with Plus Markers (✚):** Lowest-performing series.
* **Legend:** There is no explicit legend box within the chart area. The series are distinguished solely by their unique color and marker combination.
### Detailed Analysis
**Trend Verification & Data Point Extraction (Approximate Values):**
* **Light Blue (●):**
* **Trend:** Starts low, increases rapidly and smoothly, plateaus near the top, experiences a sharp dip at the requirement change, then recovers and plateaus again at a very high level.
* **Key Points:** At step 0, EGA ≈ 0.15. Rises steeply to ≈ 0.75 at step 1000. Reaches a pre-change peak of ≈ 0.95 just before step 1500. At the change (step 1500), it dips to ≈ 0.88. Recovers quickly to ≈ 0.97 by step 2000 and remains stable until step 3000.
* **Orange (✖):**
* **Trend:** Increases steadily, plateaus before the change, shows a slight dip and recovery post-change, then stabilizes.
* **Key Points:** Starts near 0.15. Reaches ≈ 0.6 at step 1000. Plateaus around 0.65 before step 1500. At the change, it dips slightly to ≈ 0.55. Recovers to ≈ 0.63 by step 2000 and remains stable.
* **Pink (◆):**
* **Trend:** Increases at a moderate rate, continues a gradual upward trend even after the requirement change.
* **Key Points:** Starts near 0.15. Reaches ≈ 0.45 at step 1000. At step 1500, it is ≈ 0.45. Shows a slight dip then continues climbing to ≈ 0.55 at step 2000 and ≈ 0.6 at step 2500.
* **Light Green (■):**
* **Trend:** Increases initially, plateaus, then experiences a significant drop at the requirement change, followed by a partial, slow recovery.
* **Key Points:** Starts near 0.15. Reaches ≈ 0.42 at step 1000. Plateaus around 0.44 before step 1500. At the change, it drops sharply to ≈ 0.35. Recovers slowly to ≈ 0.4 by step 2000 and ≈ 0.42 by step 2500.
* **Dark Gray (✚):**
* **Trend:** Shows minimal improvement, plateaus early, and suffers a severe, permanent drop at the requirement change.
* **Key Points:** Starts near 0.15. Reaches a low plateau of ≈ 0.23 by step 500, which it maintains until step 1500. At the change, it drops sharply to ≈ 0.15. Shows a very slight recovery to ≈ 0.18 by step 2000 and remains there.
### Key Observations
1. **Performance Hierarchy:** A clear and consistent performance ranking is maintained throughout most of the experiment: Light Blue > Orange > Pink > Light Green > Dark Gray.
2. **Impact of Requirement Change:** The event at step 1500 acts as a major perturbation. All series show a negative reaction (a dip or drop in EGA), but the magnitude and recovery differ drastically.
3. **Differential Robustness:** The Light Blue (●) and Orange (✖) methods demonstrate high robustness, recovering quickly and fully (or nearly fully) to their pre-change performance levels. The Pink (◆) method is uniquely unaffected in the long term, continuing its upward trend. The Light Green (■) and especially the Dark Gray (✚) methods are highly sensitive, suffering significant performance degradation with limited recovery.
4. **Convergence:** Before the change, the top three methods (Blue, Orange, Pink) appear to be converging toward high EGA values. After the change, the gap between the top method (Blue) and the others widens significantly.
### Interpretation
This chart likely compares different reinforcement learning or adaptive algorithms in a non-stationary environment where the underlying task goals ("true requirements") shift at a known point (step 1500).
* **The Light Blue (●) algorithm** is the most robust and high-performing. Its rapid recovery suggests it has an effective mechanism for detecting and adapting to change, possibly through meta-learning, a large capacity for policy adjustment, or an intrinsic motivation to explore. Its final performance is near-perfect (EGA ≈ 0.97).
* **The Orange (✖) algorithm** is also robust but has a lower performance ceiling. It adapts well but to a sub-optimal policy compared to the blue method.
* **The Pink (◆) algorithm** exhibits a different, interesting behavior. Its continuous improvement suggests it may be learning a more general or fundamental skill that is less dependent on the specific "requirements" that changed. It is not thrown off by the shift because its objective is aligned with a deeper invariance in the environment.
* **The Light Green (■) and Dark Gray (✚) algorithms** appear to be brittle. They likely overfit to the initial set of requirements. When those requirements change, their learned policies become maladaptive, and they lack the flexibility to re-learn effectively. The Dark Gray method, in particular, seems to have learned a very narrow, fixed behavior early on.
**In summary, the data demonstrates that not all learning algorithms are equal in the face of changing goals. The experiment highlights a trade-off or distinction between methods that achieve high performance in a fixed setting (potentially the early plateau of Dark Gray) and those that maintain high performance and adaptability in a dynamic, non-stationary world (exemplified by Light Blue).** The Pink method's trajectory suggests an alternative path: learning invariants that render specific requirement changes irrelevant.
DECODING INTELLIGENCE...