# Technical Data Extraction: Control Effect Analysis (Layer 16)
This document provides a comprehensive extraction of data from a technical visualization consisting of eight line charts and one heatmap. The data explores the "Control effect (d)" across various "Target axes" and "Affected axes" within a neural network context (Layer 16).
---
## 1. Component Isolation
The image is divided into two primary sections:
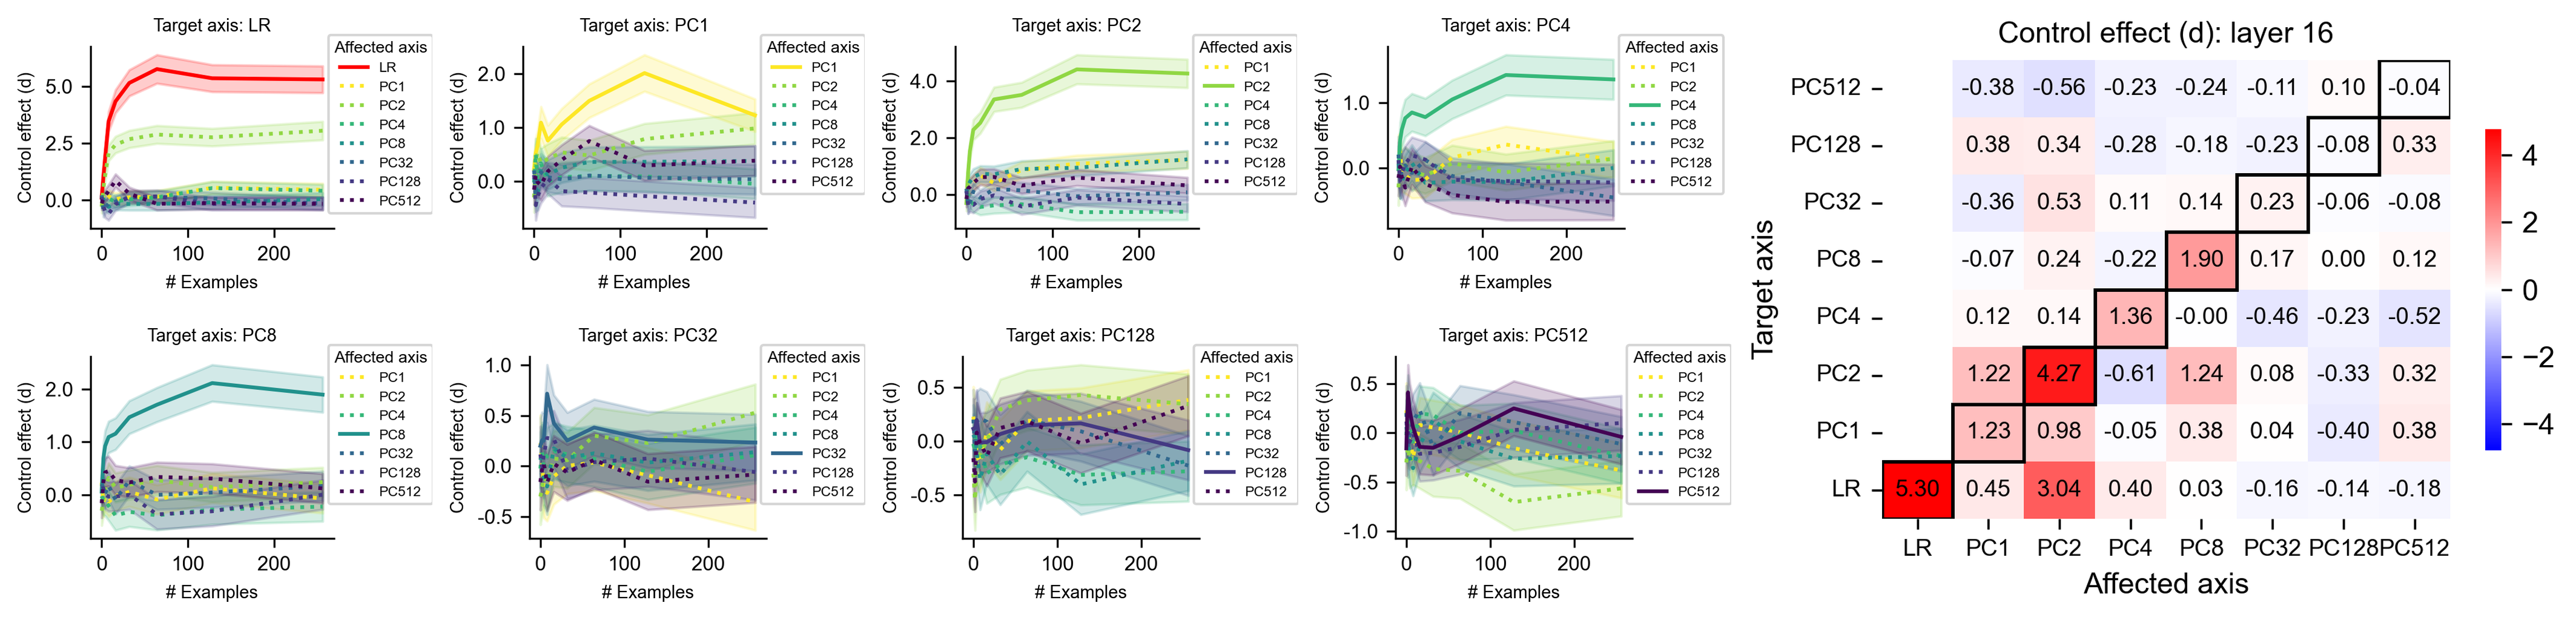
- **Left Section (Grid of 8 Line Charts):** Shows the progression of the control effect as the number of examples increases (0 to 250).
- **Right Section (Heatmap):** Summarizes the final control effect values in a matrix format.
---
## 2. Line Chart Series Analysis (Left Section)
Each chart represents a specific **Target axis**. The x-axis is labeled **"# Examples"** (ranging 0–250) and the y-axis is **"Control effect (d)"**. Each line represents an **"Affected axis"**.
### Common Legend (Affected axis)
The following categories are used across all line charts:
- **LR:** Solid Red line
- **PC1:** Yellow (Solid or Dotted)
- **PC2:** Light Green (Solid or Dotted)
- **PC4:** Medium Green (Solid or Dotted)
- **PC8:** Teal (Solid or Dotted)
- **PC32:** Blue (Solid or Dotted)
- **PC128:** Dark Purple (Solid or Dotted)
- **PC512:** Deep Indigo (Solid or Dotted)
*Note: In each chart, the line corresponding to the Target axis is typically solid and thicker, while others are dotted.*
### Individual Chart Trends
1. **Target axis: LR**
* **Trend:** The LR line (Red) shows a sharp logarithmic increase, plateauing around $d \approx 5.5$.
* **Secondary Effects:** PC2 (Light Green dotted) shows a slight positive trend ($d \approx 3.0$). Other axes remain near zero.
2. **Target axis: PC1**
* **Trend:** PC1 (Yellow) increases steadily, peaking near $d \approx 2.0$ before a slight decline.
* **Secondary Effects:** PC2 and PC4 show minor positive correlations.
3. **Target axis: PC2**
* **Trend:** PC2 (Light Green) rises sharply and plateaus at $d \approx 4.5$.
* **Secondary Effects:** LR (Red dotted) shows a significant secondary effect ($d \approx 3.0$).
4. **Target axis: PC4**
* **Trend:** PC4 (Medium Green) rises and plateaus at $d \approx 1.5$.
5. **Target axis: PC8**
* **Trend:** PC8 (Teal) rises and plateaus at $d \approx 2.0$.
6. **Target axis: PC32**
* **Trend:** PC32 (Blue) shows a low-magnitude peak ($d < 0.5$) and remains relatively flat.
7. **Target axis: PC128**
* **Trend:** PC128 (Dark Purple) shows high variance with a slight upward trend toward $d \approx 0.3$.
8. **Target axis: PC512**
* **Trend:** PC512 (Deep Indigo) shows a small initial spike followed by a decline toward zero.
---
## 3. Heatmap Data Extraction (Right Section)
**Title:** Control effect (d): layer 16
**Spatial Grounding:** The legend indicates a color scale from -4 (Blue) to 0 (White) to +4 (Red).
**Structure:** A matrix where rows are **Target axis** and columns are **Affected axis**. Values in the diagonal (top-left to bottom-right orientation in this specific plot) are highlighted with thick black borders.
### Data Table (Reconstructed)
| Target \ Affected | LR | PC1 | PC2 | PC4 | PC8 | PC32 | PC128 | PC512 |
| :--- | :---: | :---: | :---: | :---: | :---: | :---: | :---: | :---: |
| **PC512** | -0.38 | -0.56 | -0.23 | -0.24 | -0.11 | 0.10 | -0.04 | **N/A** |
| **PC128** | 0.38 | 0.34 | -0.28 | -0.18 | -0.23 | -0.08 | 0.33 | |
| **PC32** | -0.36 | 0.53 | 0.11 | 0.14 | 0.23 | -0.06 | -0.08 | |
| **PC8** | -0.07 | 0.24 | -0.22 | **1.90** | 0.17 | 0.00 | 0.12 | |
| **PC4** | 0.12 | 0.14 | **1.36** | -0.00 | -0.46 | -0.23 | -0.52 | |
| **PC2** | 1.22 | **4.27** | -0.61 | 1.24 | 0.08 | -0.33 | 0.32 | |
| **PC1** | 1.23 | 0.98 | -0.05 | 0.38 | 0.04 | -0.40 | 0.38 | |
| **LR** | **5.30** | 0.45 | 3.04 | 0.40 | 0.03 | -0.16 | -0.14 | -0.18 |
*Note: The heatmap values are transcribed directly from the cells. The bolded values represent the highest positive control effects (Red cells).*
---
## 4. Key Findings and Trends
1. **Self-Control Dominance:** The highest values are generally found on the diagonal (e.g., LR on LR = 5.30, PC2 on PC1 = 4.27).
2. **Cross-Axis Interference:** There is a strong cross-effect between **LR** and **PC2** (3.04) and **PC2** and **PC1** (4.27).
3. **Diminishing Effect:** As the PC index increases (PC32, PC128, PC512), the control effect (d) significantly decreases, with values approaching zero or becoming slightly negative (blue-tinted cells).
4. **Consistency:** The line charts and the heatmap are consistent; for example, the "Target axis: LR" line chart shows a plateau at ~5.5, which matches the heatmap value of 5.30.