# Technical Data Extraction: Resonant Inelastic X-ray Scattering (RIXS) Spectra
This document provides a comprehensive extraction of the data and components from the provided scientific figure, which displays energy loss spectra and intensity heatmaps.
## 1. Global Metadata and Scale
* **Primary Language:** English.
* **Color Scale (Bottom Left):** A linear intensity scale ranging from **0.00 to 0.30 (arb. units)**.
* **Black/Grey:** Low intensity (~0.00 - 0.05).
* **Blue/Cyan:** Low-mid intensity (~0.05 - 0.15).
* **Green/Yellow:** Mid-high intensity (~0.15 - 0.25).
* **Red/Orange:** High intensity (~0.25 - 0.30).
---
## 2. Component Analysis
### Region (a) & (b): Intensity Heatmaps (Broad Range)
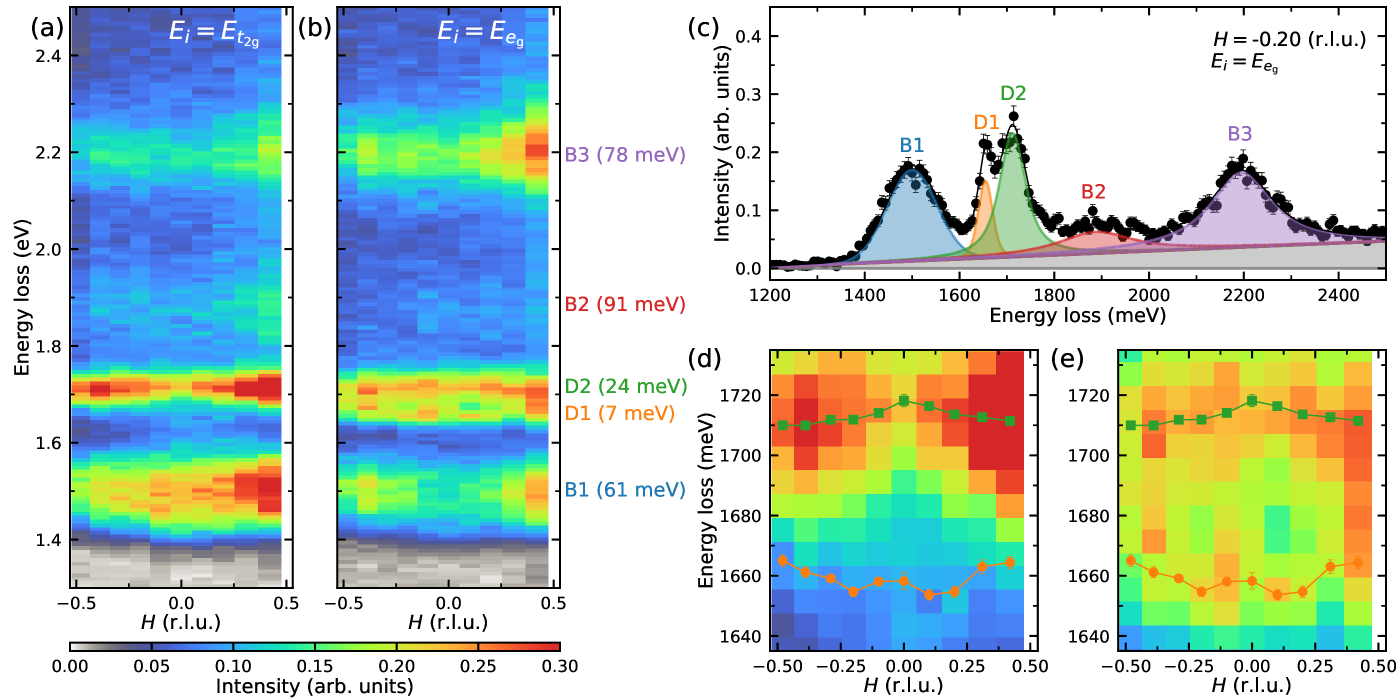
These panels show intensity as a function of momentum transfer ($H$) and Energy loss.
* **Y-axis (Shared):** Energy loss (eV), ranging from **1.3 to 2.4 eV**.
* **X-axis (Shared):** $H$ (r.l.u.), ranging from **-0.5 to 0.5**.
* **Panel (a) Condition:** $E_i = E_{t_{2g}}$
* **Panel (b) Condition:** $E_i = E_{e_g}$
* **Identified Features (Labels located between (b) and (c)):**
* **B1 (Blue):** Located at ~1.5 eV. Width/FWHM indicated as **61 meV**.
* **D1 (Orange):** Located at ~1.65 eV. Width/FWHM indicated as **7 meV**.
* **D2 (Green):** Located at ~1.71 eV. Width/FWHM indicated as **24 meV**.
* **B2 (Red):** Located at ~1.9 eV. Width/FWHM indicated as **91 meV**.
* **B3 (Purple):** Located at ~2.2 eV. Width/FWHM indicated as **78 meV**.
### Region (c): Line Profile and Peak Fitting
A detailed cross-section of the data at a specific momentum point.
* **Condition:** $H = -0.20$ (r.l.u.), $E_i = E_{e_g}$.
* **X-axis:** Energy loss (meV), ranging from **1200 to 2500 meV**.
* **Y-axis:** Intensity (arb. units), ranging from **0.0 to 0.4**.
* **Data Points:** Black circles with vertical error bars.
* **Fitted Components (Trend Verification):**
* **B1 (Blue Shaded):** Broad Gaussian/Lorentzian peak centered at ~1500 meV.
* **D1 (Orange Shaded):** Sharp, narrow peak centered at ~1650 meV.
* **D2 (Green Shaded):** Prominent peak centered at ~1710 meV.
* **B2 (Red Shaded):** Very broad, low-intensity feature centered at ~1900 meV.
* **B3 (Purple Shaded):** Broad peak centered at ~2200 meV.
* **Background (Grey Shaded):** A rising baseline starting from ~1400 meV and increasing toward higher energy loss.
### Region (d) & (e): High-Resolution Heatmaps (Zoomed)
These panels focus on the D1 and D2 features to show dispersion.
* **Y-axis (Shared):** Energy loss (meV), ranging from **1640 to 1730 meV**.
* **X-axis (Shared):** $H$ (r.l.u.), ranging from **-0.5 to 0.5**.
* **Trend Analysis:**
* **D2 (Green Line with Squares):** Shows a slight upward "hump" or cosine-like dispersion. It peaks at $H = 0$ (~1718 meV) and dips slightly toward $H = \pm 0.5$ (~1710 meV).
* **D1 (Orange Line with Circles):** Shows a slight downward dip at $H = 0$ (~1655 meV) and rises slightly toward the edges (~1665 meV).
* **Panel (d):** Raw intensity heatmap with overlaid dispersion points.
* **Panel (e):** Appears to be a processed or different resonance version of the same energy range, showing clearer separation of the D1 and D2 tracks.
---
## 3. Summary of Extracted Data Points (Approximate)
| Feature | Energy Center (meV) | Energy Center (eV) | Width (meV) | Color Code |
| :--- | :--- | :--- | :--- | :--- |
| **B1** | ~1500 | 1.50 | 61 | Blue |
| **D1** | ~1660 | 1.66 | 7 | Orange |
| **D2** | ~1715 | 1.71 | 24 | Green |
| **B2** | ~1900 | 1.90 | 91 | Red |
| **B3** | ~2200 | 2.20 | 78 | Purple |
## 4. Spatial Grounding of Labels
* **Legend/Labels [x, y]:** The primary labels for the peaks (B1, D1, D2, B2, B3) are positioned vertically between the heatmap (b) and the line plot (c), aligned with their respective energy levels on the Y-axis.
* **Panel Labels:** (a) Top-left of first heatmap; (b) Top-left of second heatmap; (c) Top-left of line plot; (d) Top-left of first zoomed heatmap; (e) Top-left of second zoomed heatmap.