## Scatter Plot: Accuracy Variance Across 100 Clients on CIFAR-100
### Overview
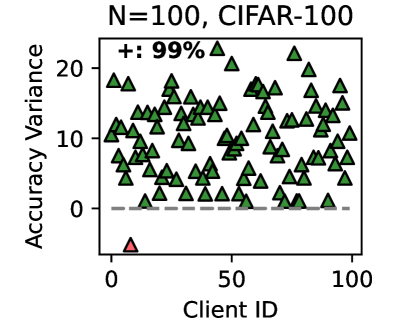
The image is a scatter plot visualizing the "Accuracy Variance" for 100 distinct clients, identified by their "Client ID," in an experiment using the CIFAR-100 dataset. The plot contains 100 data points, with 99 represented by green triangles and one represented by a red triangle.
### Components/Axes
* **Title:** "N=100, CIFAR-100" (Top center)
* **Y-Axis:** Labeled "Accuracy Variance". The scale runs from 0 to 20, with major tick marks at 0, 10, and 20. A dashed horizontal line is present at y=0.
* **X-Axis:** Labeled "Client ID". The scale runs from 0 to 100, with major tick marks at 0, 50, and 100.
* **Legend:** Located in the top-left corner of the plot area. It shows a green triangle symbol followed by the text "+: 99%". This indicates that 99 of the 100 data points (99%) are of this type.
* **Data Points:**
* **Green Triangles:** 99 points, scattered across the plot.
* **Red Triangle:** 1 point, located as an outlier.
### Detailed Analysis
* **Data Distribution (Green Triangles):** The 99 green triangles are distributed across the full range of Client IDs (approximately 1 to 99). Their Accuracy Variance values are predominantly positive, ranging from just above 0 to just above 20. The points form a dense cloud with no single, clear linear trend. The highest concentration appears between Client IDs ~10-90 and Accuracy Variance ~0-15.
* **Outlier (Red Triangle):** A single red triangle is positioned at approximately Client ID = 5 and Accuracy Variance = -5. This point is a clear outlier, lying significantly below the y=0 baseline and outside the main cluster of data.
* **Legend Cross-Reference:** The legend explicitly states that the green triangle symbol represents 99% of the data. Visually, this is confirmed: 99 out of 100 points are green triangles. The red triangle is not represented in the legend, marking it as an exceptional case.
### Key Observations
1. **High Variance Prevalence:** The vast majority of clients (99%) exhibit a positive Accuracy Variance, with values spread widely between 0 and over 20.
2. **Single Critical Outlier:** One client (ID ~5) shows a negative Accuracy Variance (approx. -5), which is anomalous compared to the entire dataset.
3. **No Client ID Correlation:** There is no apparent visual correlation between the Client ID (x-axis) and the Accuracy Variance (y-axis). High and low variance values appear across the entire range of client identifiers.
4. **Baseline Reference:** The dashed line at y=0 serves as a critical reference, highlighting that nearly all variance is positive, except for the single outlier.
### Interpretation
This plot likely originates from a **federated or distributed machine learning** context, where a model is trained across 100 different clients (e.g., devices or institutions) using the CIFAR-100 image classification dataset.
* **What the Data Suggests:** "Accuracy Variance" probably measures the instability or fluctuation in a client's model performance (e.g., across training rounds or data batches). The high positive variance for 99 clients indicates that their model accuracy is **unstable**, changing significantly during the process. This could be due to non-IID (non-identically and independently distributed) data across clients, small local datasets, or high learning rates.
* **The Outlier's Significance:** The single client with *negative* variance is a major anomaly. In many contexts, negative variance is a mathematical impossibility, suggesting this could be a **measurement error, a malicious client** submitting corrupted updates, or a client with a fundamentally different data distribution causing a breakdown in the variance calculation. Its identification is crucial for debugging or ensuring robust aggregation in federated learning.
* **Overall Implication:** The system exhibits high heterogeneity and instability across nearly all participants. The federated learning process is not converging to a stable state for individual clients. The presence of one severely anomalous client further complicates aggregation and could poison the global model if not detected and handled. The plot argues for the need for techniques like variance reduction, robust aggregation rules, or outlier detection mechanisms.