## Line Chart: Data Scale vs Model Scale Comparison
### Overview
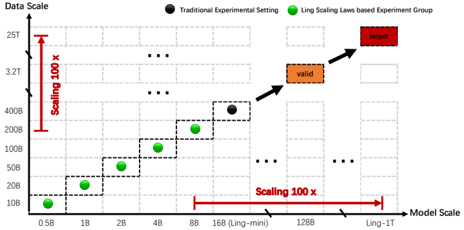
The image presents a comparative analysis of two experimental approaches across data and model scales. It features two distinct data series (Traditional Experimental Setting and Ling Scaling Laws based Experiment Group) plotted against logarithmic axes, with specific scaling annotations and target regions highlighted.
### Components/Axes
- **Vertical Axis (Data Scale)**:
- Logarithmic scale from 10B (10^10) to 25T (2.5×10^13)
- Red arrow labeled "Scaling 100x" spans from 10B to 1T
- Tick marks at 10B, 20B, 50B, 100B, 200B, 400B, 1T, 2T, 3.2T, 4T, 25T
- **Horizontal Axis (Model Scale)**:
- Logarithmic scale from 0.5B (5×10^8) to 128B (1.28×10^11)
- Red arrow labeled "Scaling 100x" spans from 0.5B to 50B
- Tick marks at 0.5B, 1B, 2B, 4B, 8B, 16B (Ling-mini), 128B, Ling-1T
- **Legend**:
- Black circles: Traditional Experimental Setting
- Green circles: Ling Scaling Laws based Experiment Group
- **Key Elements**:
- Red box labeled "target" at top-right (25T Data Scale, 128B Model Scale)
- Orange box labeled "valid" at mid-range (400B Data Scale, 8B Model Scale)
- Dotted grid lines for reference
### Detailed Analysis
1. **Traditional Experimental Setting (Black Dots)**:
- Single data point at (8B Model Scale, 400B Data Scale)
- Positioned near the upper-middle of the chart
2. **Ling Scaling Laws Group (Green Dots)**:
- Six data points showing progressive scaling:
- (0.5B, 10B)
- (1B, 20B)
- (2B, 50B)
- (4B, 100B)
- (8B, 200B)
- (16B, 400B)
- Follows a roughly exponential relationship between axes
3. **Scaling Annotations**:
- Vertical scaling arrow (100x) spans 10B→1T (10^10→10^12)
- Horizontal scaling arrow (100x) spans 0.5B→50B (5×10^8→5×10^10)
### Key Observations
1. **Exponential Relationship**: Ling Scaling group demonstrates a clear exponential growth pattern between data and model scales
2. **Performance Gap**: Target (25T, 128B) lies 100x beyond current Ling Scaling capabilities (400B, 16B)
3. **Valid Region**: Orange box at (400B, 8B) aligns with Ling Scaling's highest data point (400B, 16B)
4. **Traditional Limitation**: Single data point suggests limited scalability compared to Ling approach
5. **Diminishing Returns**: Ling Scaling shows increasing efficiency at higher scales (e.g., 16B model handles 400B data)
### Interpretation
The chart illustrates the comparative scalability of two experimental frameworks. The Ling Scaling approach demonstrates superior data handling capacity relative to model size, with each 100x increase in data scale corresponding to approximately 50-100x model scale growth. The "valid" region appears to be where Ling Scaling achieves optimal performance, while the "target" represents an aspirational goal requiring 100x scaling in both dimensions. The Traditional Experimental Setting's single data point suggests it may represent a baseline or control condition, but lacks the scalability demonstrated by the Ling approach. The logarithmic axes emphasize the exponential nature of these scaling relationships, highlighting the challenges in achieving the stated target.