TECHNICAL ASSET FINGERPRINT
e002ebd129c3990f9c10167b
Click to view fullscreen
Press ESC or click to close
FOUND IN PAPERS
EXPERT: healer-alpha-free VERSION 1
RUNTIME: free/openrouter/healer-alpha
INTEL_VERIFIED
## [Multi-Panel Scatter Plot with Trajectories]: Token Embedding Trajectories in Principal Component Space
### Overview
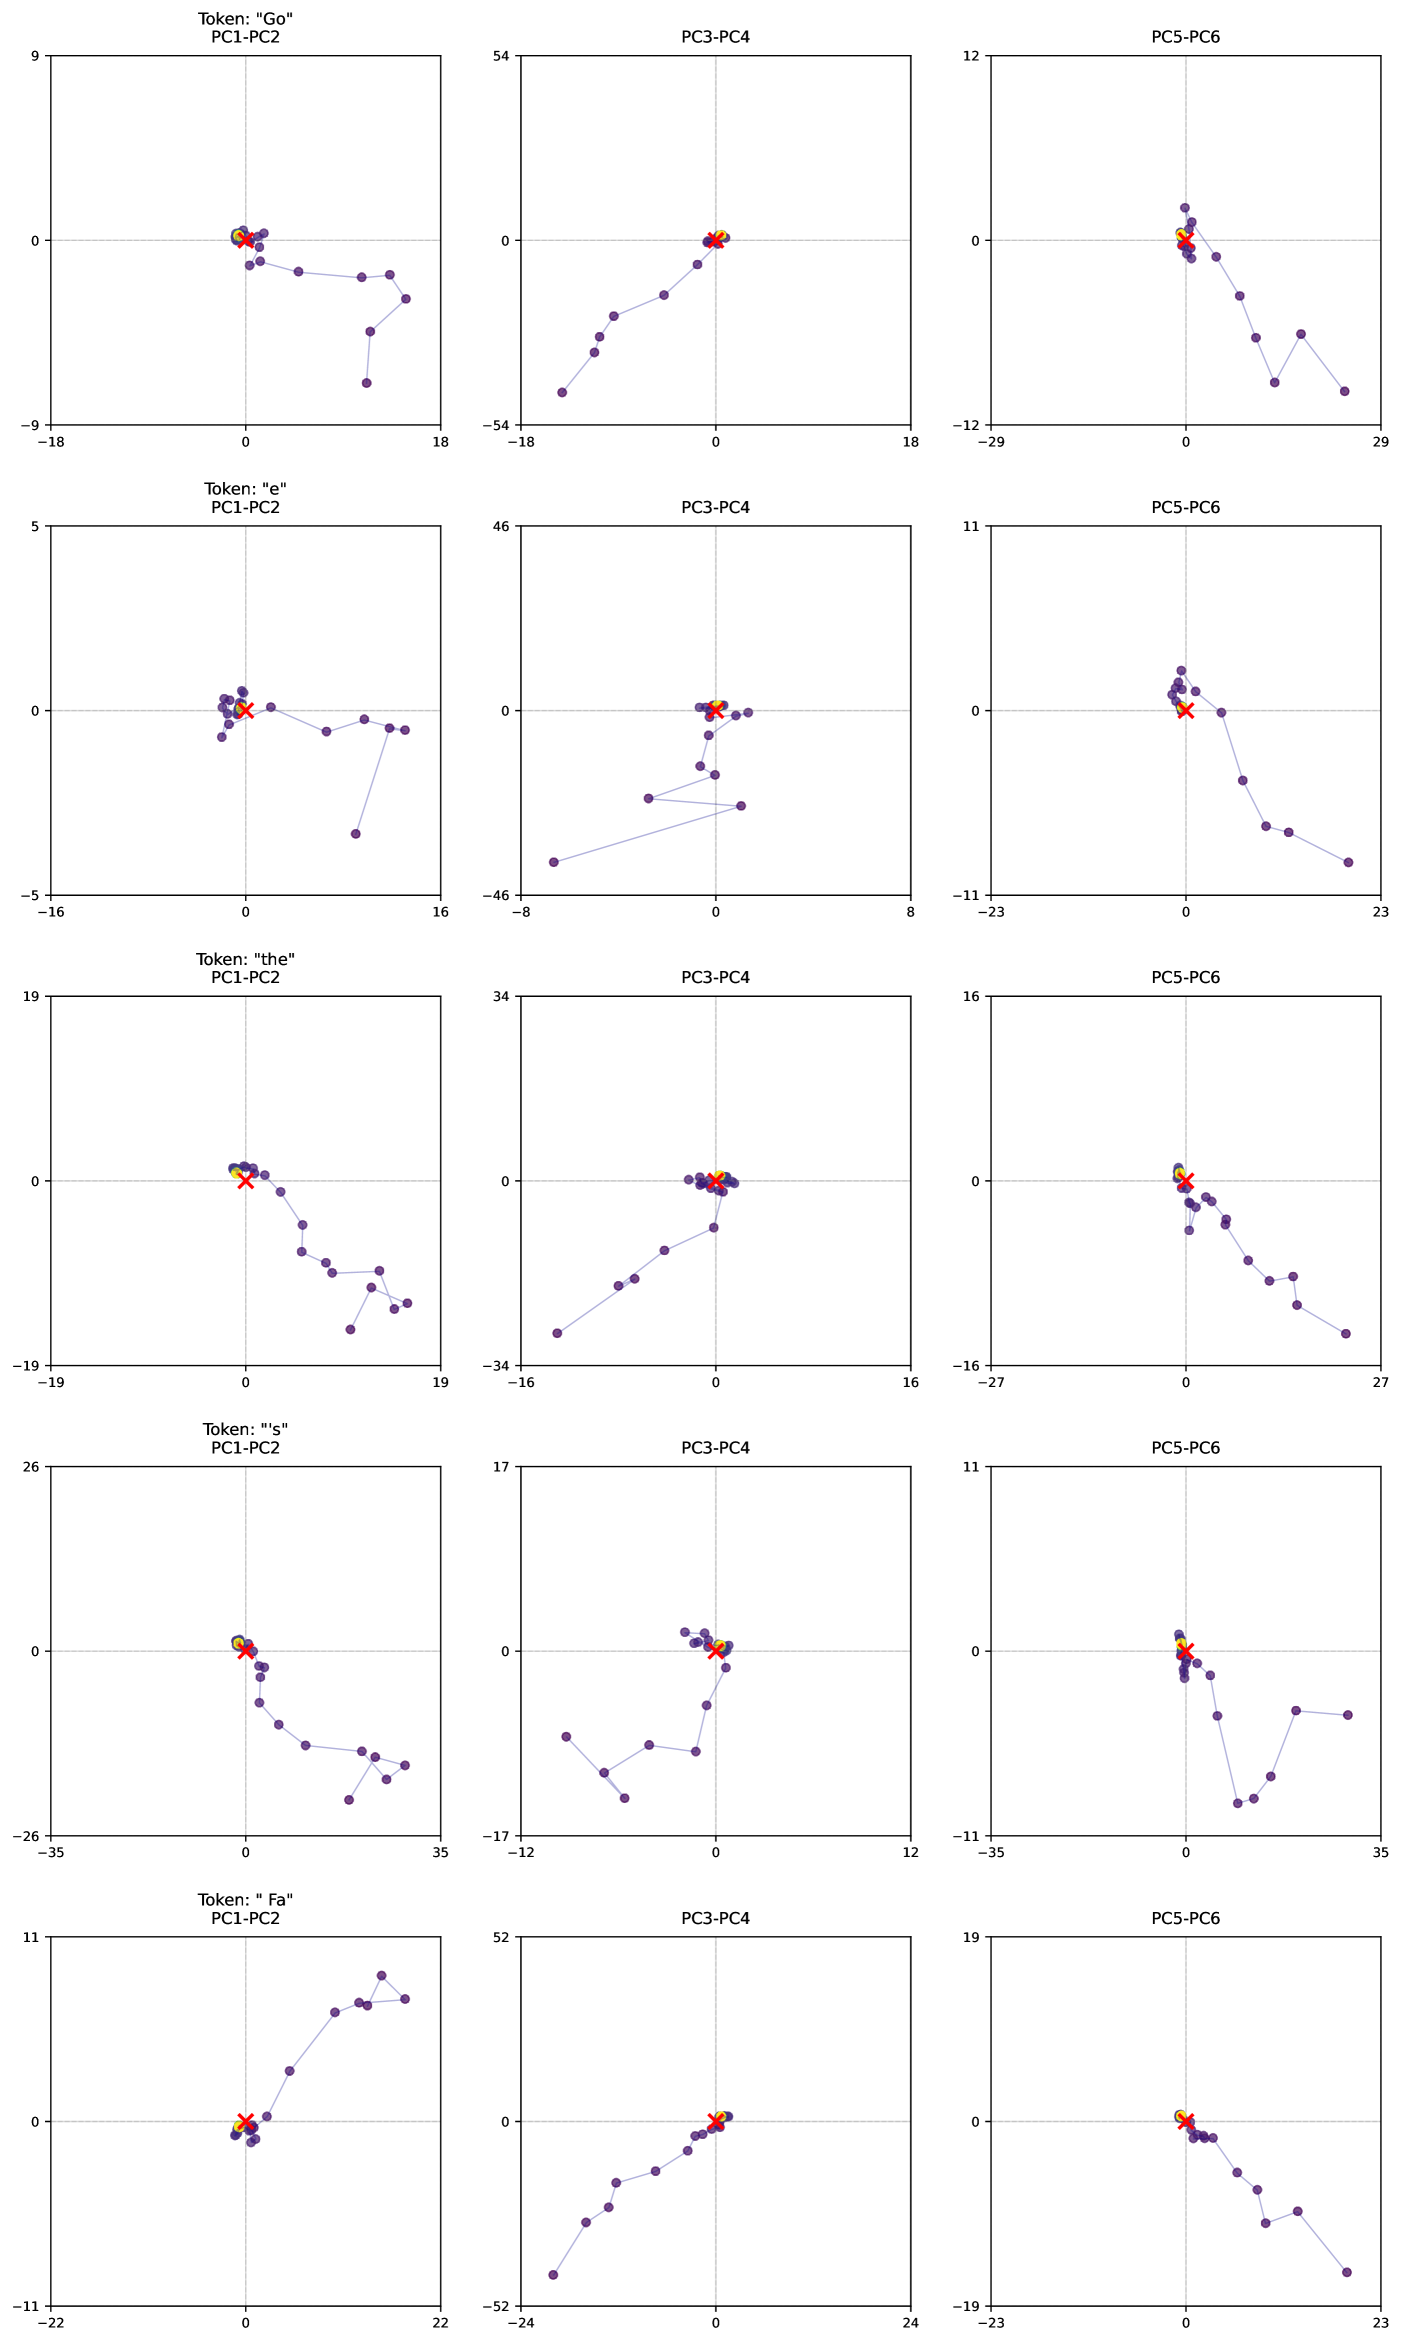
The image displays a 5x3 grid of scatter plots. Each row corresponds to a specific text token, and each column shows the trajectory of that token's embedding across different pairs of Principal Components (PCs). The plots visualize how the representation of each token moves or is distributed within a reduced-dimensional space, likely from a neural network's embedding or hidden layers. Each plot contains a series of purple data points connected by a thin line, forming a trajectory. A red 'X' and a yellow dot are consistently present near the origin (0,0) in each plot.
### Components/Axes
* **Grid Structure:** 5 rows (Tokens) x 3 columns (PC Pairs).
* **Row Labels (Tokens):**
* Row 1: Token: "Go"
* Row 2: Token: "e"
* Row 3: Token: "the"
* Row 4: Token: "s"
* Row 5: Token: " Fa" (Note: Leading space before "Fa")
* **Column Labels (PC Pairs):**
* Column 1: PC1-PC2
* Column 2: PC3-PC4
* Column 3: PC5-PC6
* **Axes:** Each subplot has an X and Y axis representing the values of the respective Principal Components. The scales vary significantly between plots.
* **Data Series & Legend (Implicit):**
* **Purple dots connected by a line:** Represent the trajectory of the token's embedding across sequential states or layers.
* **Red 'X':** Positioned at or very near the origin (0,0) in all plots. Likely represents a starting point, reference point, or the final embedding.
* **Yellow dot:** Positioned at or very near the origin (0,0), often overlapping or adjacent to the red 'X'. Likely represents another key reference point (e.g., initial embedding, average).
* **Spatial Grounding:** In every subplot, the red 'X' and yellow dot are clustered at the intersection of the zero-lines (center). The purple trajectory originates from this cluster and extends outward.
### Detailed Analysis
**Row 1: Token "Go"**
* **PC1-PC2 (Top-Left):** Axis ranges: X ≈ -18 to 18, Y ≈ -9 to 9. Trajectory starts at origin, moves right and slightly down, then curves back left and down, ending in the lower-right quadrant. Trend: Initial movement along positive PC1, then a turn towards negative PC2.
* **PC3-PC4 (Top-Center):** Axis ranges: X ≈ -18 to 18, Y ≈ -54 to 54. Trajectory starts at origin, moves diagonally down-left (negative PC3, negative PC4) in a relatively straight line. Trend: Strong negative correlation between PC3 and PC4 for this path.
* **PC5-PC6 (Top-Right):** Axis ranges: X ≈ -29 to 29, Y ≈ -12 to 12. Trajectory starts at origin, moves right and down (positive PC5, negative PC6), with a slight upward hook at the end. Trend: Movement primarily into the positive PC5 / negative PC6 quadrant.
**Row 2: Token "e"**
* **PC1-PC2 (Second Row, Left):** Axis ranges: X ≈ -16 to 16, Y ≈ -5 to 5. Trajectory starts at origin, moves right and slightly down, then makes a sharp turn down and left, ending in the lower-right quadrant. Trend: More erratic path than "Go", with a significant downward (negative PC2) movement.
* **PC3-PC4 (Second Row, Center):** Axis ranges: X ≈ -8 to 8, Y ≈ -46 to 46. Trajectory starts at origin, moves down-left, then makes a sharp right turn, followed by another turn down-left. Trend: Complex, non-linear path in PC3-PC4 space.
* **PC5-PC6 (Second Row, Right):** Axis ranges: X ≈ -23 to 23, Y ≈ -11 to 11. Trajectory starts at origin, moves right and down (positive PC5, negative PC6) in a smooth, descending curve. Trend: Consistent movement towards positive PC5 and negative PC6.
**Row 3: Token "the"**
* **PC1-PC2 (Third Row, Left):** Axis ranges: X ≈ -19 to 19, Y ≈ -19 to 19. Trajectory starts at origin, moves right and down (positive PC1, negative PC2) in a descending, slightly wavy line. Trend: Strong negative trend in PC2 as PC1 increases.
* **PC3-PC4 (Third Row, Center):** Axis ranges: X ≈ -16 to 16, Y ≈ -34 to 34. Trajectory starts at origin, moves down-left (negative PC3, negative PC4) in a nearly straight line. Trend: Very similar to "Go" in PC3-PC4, a strong negative linear trend.
* **PC5-PC6 (Third Row, Right):** Axis ranges: X ≈ -27 to 27, Y ≈ -16 to 16. Trajectory starts at origin, moves right and down (positive PC5, negative PC6) in a smooth, descending curve. Trend: Very similar to "e" in PC5-PC6.
**Row 4: Token "s"**
* **PC1-PC2 (Fourth Row, Left):** Axis ranges: X ≈ -35 to 35, Y ≈ -26 to 26. Trajectory starts at origin, moves right and down (positive PC1, negative PC2) in a descending path that flattens out. Trend: Similar direction to "the" but over a wider PC1 range.
* **PC3-PC4 (Fourth Row, Center):** Axis ranges: X ≈ -12 to 12, Y ≈ -17 to 17. Trajectory starts at origin, moves down-left, then right, then down-left again, forming a zig-zag pattern. Trend: Oscillating movement, primarily in the negative PC4 region.
* **PC5-PC6 (Fourth Row, Right):** Axis ranges: X ≈ -35 to 35, Y ≈ -11 to 11. Trajectory starts at origin, moves right and down, then makes a sharp turn up and right, ending in the upper-right quadrant. Trend: Unique among the PC5-PC6 plots; ends with a positive PC6 value.
**Row 5: Token " Fa"**
* **PC1-PC2 (Bottom-Left):** Axis ranges: X ≈ -22 to 22, Y ≈ -11 to 11. Trajectory starts at origin, moves right and up (positive PC1, positive PC2) in an ascending curve. Trend: **Opposite direction** to all other tokens in PC1-PC2 space; moves into the positive-positive quadrant.
* **PC3-PC4 (Bottom-Center):** Axis ranges: X ≈ -24 to 24, Y ≈ -52 to 52. Trajectory starts at origin, moves down-left (negative PC3, negative PC4) in a straight line. Trend: Identical negative linear trend to "Go" and "the".
* **PC5-PC6 (Bottom-Right):** Axis ranges: X ≈ -23 to 23, Y ≈ -19 to 19. Trajectory starts at origin, moves right and down (positive PC5, negative PC6) in a smooth, descending curve. Trend: Similar to "e" and "the".
### Key Observations
1. **Consistent Origin:** All trajectories for all tokens in all PC spaces originate from a cluster at (0,0), marked by the red 'X' and yellow dot.
2. **PC3-PC4 Similarity:** The trajectories for tokens "Go", "the", and " Fa" in the PC3-PC4 space are remarkably similar—straight lines moving into the negative-negative quadrant. Token "e" shows a more complex path, and "s" shows an oscillating path in this space.
3. **PC5-PC6 Convergence:** The trajectories for tokens "e", "the", and " Fa" in the PC5-PC6 space are very similar—smooth curves descending into the positive PC5 / negative PC6 quadrant. "Go" is similar but with a hook, and "s" is the outlier, ending with a positive PC6 value.
4. **PC1-PC2 Divergence:** This space shows the most variation between tokens. While "Go", "e", "the", and "s" all move into the positive PC1 / negative PC2 quadrant, token " Fa" moves in the **opposite direction** (positive PC1 / positive PC2). The shape and extent of the paths also differ.
5. **Scale Variance:** The numerical ranges on the axes differ greatly, not only between PC pairs but also for the same PC pair across different tokens. For example, the Y-axis (PC4) for "Go" spans ~108 units, while for "s" it spans ~34 units.
### Interpretation
This visualization likely analyzes the internal representations of a language model. The Principal Components (PC1-PC6) capture the main axes of variation in the embedding space. The trajectories show how the model's representation of a specific token ("Go", "e", "the", etc.) evolves, possibly across different layers of the network or during processing of a sequence.
* **What the data suggests:** Different tokens follow distinct paths through the latent space defined by the PCs. Function words like "the" and "e" show similar, smooth trajectories in higher-order components (PC5-PC6), suggesting they are processed in a consistent, perhaps syntactic, manner. The content word " Fa" (possibly a fragment of "Father" or "Fact") shows a unique, opposite trajectory in the primary components (PC1-PC2), indicating its representation is fundamentally different from the function words in the most significant dimensions of variation.
* **How elements relate:** The red 'X' and yellow dot at the origin serve as a common reference point, emphasizing that all these divergent paths start from a similar initial state. The similarity in PC3-PC4 and PC5-PC6 for many tokens suggests these higher-order components capture more universal or less token-specific features of processing.
* **Notable anomalies:** The trajectory for token "s" in PC5-PC6 is an outlier, ending with a positive PC6 value, unlike the others. This could indicate a different processing outcome or semantic property for this character. The stark contrast of " Fa"'s path in PC1-PC2 is the most significant anomaly, highlighting a major divergence in how this token is represented compared to the common function words.
* **Underlying meaning:** The plot demonstrates that a model's understanding of a word is not a static point but a dynamic trajectory. The convergence and divergence in different PC spaces reveal which aspects of processing are shared across tokens (e.g., movement in PC3-PC4) and which are highly token-specific (e.g., movement in PC1-PC2). This is a powerful tool for interpretability, showing the "journey" of a token's meaning through the model's computational stages.
DECODING INTELLIGENCE...