## Bar Charts: Performance vs. Files Modified and Patch Size
### Overview
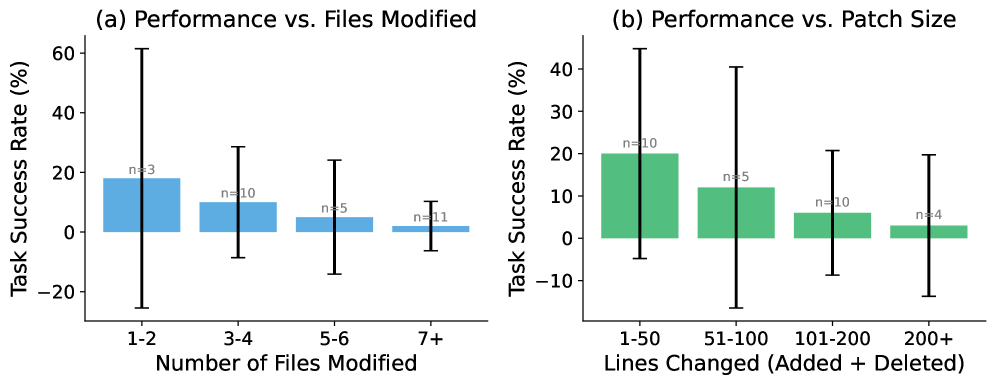
The image presents two bar charts comparing task success rate (%) against (a) the number of files modified and (b) the patch size (lines changed). Each bar represents a range of values for the independent variable (files modified or patch size), and the height of the bar indicates the average task success rate for that range. Error bars are included to show the variability in the data. The sample size 'n' is indicated above each bar.
### Components/Axes
**Chart (a): Performance vs. Files Modified**
* **Title:** (a) Performance vs. Files Modified
* **Y-axis:** Task Success Rate (%)
* Scale: 0 to 60, with tick marks at 0, 20, 40, and 60. Negative values are also shown to -20.
* **X-axis:** Number of Files Modified
* Categories: 1-2, 3-4, 5-6, 7+
* **Bar Color:** Light Blue
* **Error Bars:** Black lines indicating variability.
* **Sample Size:** 'n' values are displayed above each bar.
**Chart (b): Performance vs. Patch Size**
* **Title:** (b) Performance vs. Patch Size
* **Y-axis:** Task Success Rate (%)
* Scale: 0 to 40, with tick marks at 0, 10, 20, 30, and 40. Negative values are also shown to -10.
* **X-axis:** Lines Changed (Added + Deleted)
* Categories: 1-50, 51-100, 101-200, 200+
* **Bar Color:** Green
* **Error Bars:** Black lines indicating variability.
* **Sample Size:** 'n' values are displayed above each bar.
### Detailed Analysis
**Chart (a): Performance vs. Files Modified**
* **1-2 Files Modified:**
* Task Success Rate: Approximately 18%
* Sample Size (n): 3
* Error Bar: Extends from approximately -25% to 60%
* **3-4 Files Modified:**
* Task Success Rate: Approximately 10%
* Sample Size (n): 10
* Error Bar: Extends from approximately -10% to 30%
* **5-6 Files Modified:**
* Task Success Rate: Approximately 5%
* Sample Size (n): 5
* Error Bar: Extends from approximately -15% to 25%
* **7+ Files Modified:**
* Task Success Rate: Approximately 2%
* Sample Size (n): 11
* Error Bar: Extends from approximately -5% to 10%
**Trend (a):** The task success rate generally decreases as the number of files modified increases.
**Chart (b): Performance vs. Patch Size**
* **1-50 Lines Changed:**
* Task Success Rate: Approximately 20%
* Sample Size (n): 10
* Error Bar: Extends from approximately -5% to 45%
* **51-100 Lines Changed:**
* Task Success Rate: Approximately 12%
* Sample Size (n): 5
* Error Bar: Extends from approximately -15% to 40%
* **101-200 Lines Changed:**
* Task Success Rate: Approximately 7%
* Sample Size (n): 10
* Error Bar: Extends from approximately -10% to 25%
* **200+ Lines Changed:**
* Task Success Rate: Approximately 3%
* Sample Size (n): 4
* Error Bar: Extends from approximately -15% to 20%
**Trend (b):** The task success rate generally decreases as the number of lines changed (patch size) increases.
### Key Observations
* In both charts, the highest task success rate is observed when the number of files modified or lines changed is the lowest (1-2 files or 1-50 lines).
* The error bars are quite large, indicating substantial variability in the task success rates within each category.
* The sample sizes vary across the categories, which could affect the reliability of the average task success rates.
### Interpretation
The data suggests that smaller changes (fewer files modified or smaller patch sizes) are associated with higher task success rates. This could be because smaller changes are easier to understand, review, and integrate, leading to fewer errors. The large error bars indicate that other factors besides the number of files or lines changed also influence task success. The decreasing trend in task success rate with increasing files modified or lines changed could be due to increased complexity and potential for errors in larger changesets. The sample sizes are relatively small, especially for the '1-2 files' and '200+ lines' categories, which limits the generalizability of the findings.