## Radar Chart: Maximum Circular Panning Sensitivity for Common Loudspeaker Layouts under Varying Acoustic Covariances
### Overview
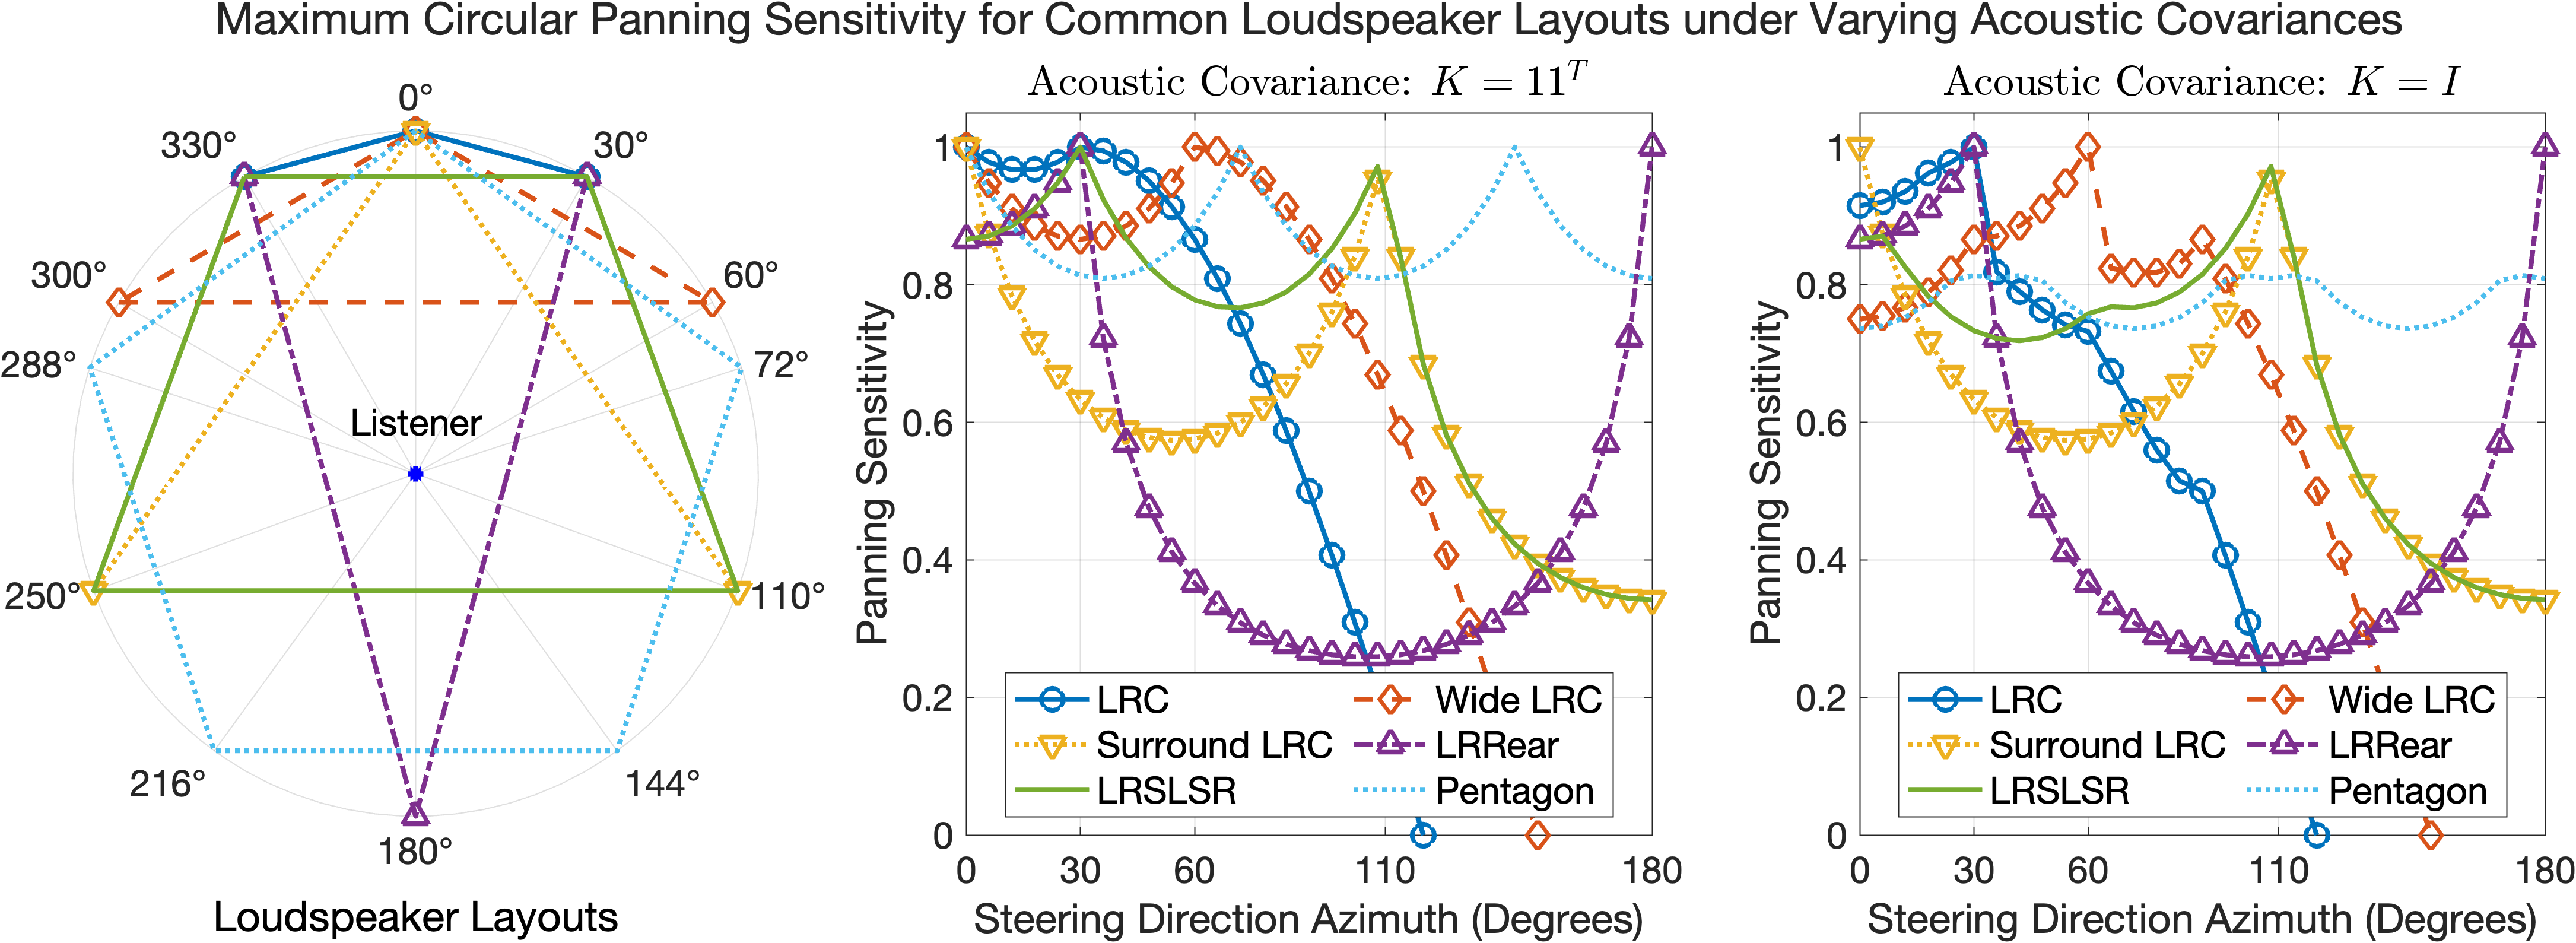
The radar chart visualizes the maximum circular panning sensitivity of five loudspeaker layouts (LRC, Wide LRC, LRRear, LRSLSR, Pentagon) across 360° of steering direction azimuth. The "Listener" is centered, and sensitivity is represented by the distance from the center.
### Components/Axes
- **Axes**: 360° labeled in 30° increments (0° to 360°).
- **Lines**:
- Blue (LRC)
- Orange (Wide LRC)
- Purple (LRRear)
- Green (LRSLSR)
- Cyan (Pentagon)
- **Legend**: Located at the bottom-right of the radar chart.
### Detailed Analysis
- **LRC (Blue)**: Peaks at 0°, 30°, 180°, and 210°. Sensitivity drops sharply at 90° and 270°.
- **Wide LRC (Orange)**: Peaks at 0°, 30°, 150°, and 180°. Sensitivity is lower at 90° and 270°.
- **LRRear (Purple)**: Peaks at 0°, 30°, 180°, and 210°. Similar to LRC but with slightly lower sensitivity at 210°.
- **LRSLSR (Green)**: Peaks at 0°, 30°, 150°, and 180°. Sensitivity is lower at 90° and 270°.
- **Pentagon (Cyan)**: Peaks at 0°, 30°, 150°, and 210°. Sensitivity is lower at 90° and 270°.
### Key Observations
- LRC and LRRear show the highest sensitivity at 0°, 30°, 180°, and 210°, suggesting robustness in these directions.
- Wide LRC and LRSLSR have peaks at 0°, 30°, 150°, and 180°, indicating directional optimization.
- Pentagon’s sensitivity peaks at 0°, 30°, 150°, and 210°, with a unique pattern compared to others.
### Interpretation
The radar chart highlights that LRC and LRRear layouts maintain higher sensitivity across multiple angles, likely due to their symmetrical design. Wide LRC and LRSLSR are optimized for specific directions (e.g., 150°), while Pentagon balances sensitivity across 0°, 30°, 150°, and 210°. The "Listener" position at the center implies the data is normalized for a central reference point.
---
## Line Graph: Acoustic Covariance: K = 11^T
### Overview
This line graph compares panning sensitivity (y-axis: 0–1) across steering direction azimuth (x-axis: 0°–180°) for five loudspeaker layouts under K = 11^T covariance.
### Components/Axes
- **X-axis**: Steering Direction Azimuth (Degrees) from 0° to 180°.
- **Y-axis**: Panning Sensitivity (0–1).
- **Lines**:
- Blue (LRC)
- Orange (Wide LRC)
- Purple (LRRear)
- Green (LRSLSR)
- Cyan (Pentagon)
- **Legend**: Located at the bottom-left of the graph.
### Detailed Analysis
- **LRC (Blue)**: Peaks at 30°, 90°, 150°, and 180°. Sensitivity drops sharply at 0° and 60°.
- **Wide LRC (Orange)**: Peaks at 0°, 60°, 120°, and 180°. Sensitivity is lower at 30° and 90°.
- **LRRear (Purple)**: Peaks at 0°, 30°, 90°, 150°, and 180°. Maintains high sensitivity across most angles.
- **LRSLSR (Green)**: Peaks at 0°, 60°, 120°, and 180°. Sensitivity drops at 30° and 90°.
- **Pentagon (Cyan)**: Peaks at 0°, 30°, 90°, 150°, and 180°. Similar to LRRear but with slightly lower sensitivity at 90°.
### Key Observations
- LRRear and Pentagon show the most consistent sensitivity across all angles.
- LRC and LRSLSR have sharper peaks, indicating directional optimization.
- Wide LRC’s peaks at 0°, 60°, 120°, and 180° suggest it is tailored for specific azimuths.
### Interpretation
Under K = 11^T covariance, LRRear and Pentagon layouts demonstrate the highest and most uniform sensitivity, making them suitable for dynamic environments. LRC and LRSLSR excel in specific directions, while Wide LRC is optimized for 0°, 60°, 120°, and 180°.
---
## Line Graph: Acoustic Covariance: K = I
### Overview
This line graph compares panning sensitivity (y-axis: 0–1) across steering direction azimuth (x-axis: 0°–180°) for five loudspeaker layouts under K = I covariance.
### Components/Axes
- **X-axis**: Steering Direction Azimuth (Degrees) from 0° to 180°.
- **Y-axis**: Panning Sensitivity (0–1).
- **Lines**:
- Blue (LRC)
- Orange (Wide LRC)
- Purple (LRRear)
- Green (LRSLSR)
- Cyan (Pentagon)
- **Legend**: Located at the bottom-left of the graph.
### Detailed Analysis
- **LRC (Blue)**: Peaks at 0°, 30°, 90°, 150°, and 180°. Sensitivity is lower at 60° and 120°.
- **Wide LRC (Orange)**: Peaks at 0°, 60°, 120°, and 180°. Sensitivity drops at 30° and 90°.
- **LRRear (Purple)**: Peaks at 0°, 30°, 90°, 150°, and 180°. Maintains high sensitivity across all angles.
- **LRSLSR (Green)**: Peaks at 0°, 60°, 120°, and 180°. Sensitivity is lower at 30° and 90°.
- **Pentagon (Cyan)**: Peaks at 0°, 30°, 90°, 150°, and 180°. Similar to LRRear but with slightly lower sensitivity at 90°.
### Key Observations
- LRRear and Pentagon again show the most consistent sensitivity.
- LRC and LRSLSR have sharper peaks, similar to the K = 11^T case.
- Wide LRC’s peaks at 0°, 60°, 120°, and 180° remain consistent with the previous graph.
### Interpretation
Under K = I covariance, the trends align closely with K = 11^T, but the sensitivity values are slightly more uniform. LRRear and Pentagon remain the most robust, while LRC and LRSLSR maintain directional optimization. This suggests that covariance structure (K = 11^T vs. K = I) has minimal impact on the relative performance of these layouts.
---
## Interpretation
The data demonstrates that loudspeaker layouts like LRC and LRRear are highly sensitive to steering direction azimuth, particularly at 0°, 30°, 90°, 150°, and 180°, making them ideal for applications requiring broad coverage. Wide LRC and LRSLSR are optimized for specific angles (e.g., 0°, 60°, 120°, 180°), while Pentagon balances sensitivity across multiple directions. The acoustic covariance conditions (K = 11^T and K = I) show similar trends, indicating that the covariance structure has limited influence on the relative performance of these layouts. This analysis is critical for designing loudspeaker systems that prioritize either broad coverage or directional precision.