\n
## Bar Charts: Performance Metrics by Discipline
### Overview
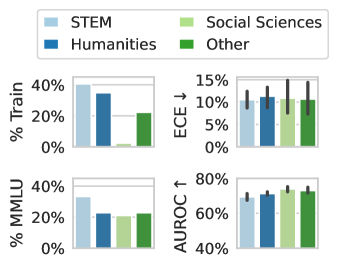
The image presents four bar charts arranged in a 2x2 grid, comparing performance metrics across four academic disciplines: STEM, Humanities, Social Sciences, and Other. The metrics are "% Train", "ECE ↓", "% MMLU", and "AUROC ↑". Each chart displays the percentage or value for each discipline, with error bars present in the "ECE ↓" and "AUROC ↑" charts.
### Components/Axes
* **Legend (Top-Center):**
* STEM (Light Blue)
* Humanities (Dark Blue)
* Social Sciences (Light Green)
* Other (Dark Green)
* **Chart 1 (Top-Left):**
* X-axis: Disciplines (STEM, Humanities, Social Sciences, Other)
* Y-axis: % Train (0% to 40%)
* **Chart 2 (Top-Right):**
* X-axis: Disciplines (STEM, Humanities, Social Sciences, Other)
* Y-axis: ECE ↓ (0% to 15%) - Note the downward arrow indicates a minimization goal.
* **Chart 3 (Bottom-Left):**
* X-axis: Disciplines (STEM, Humanities, Social Sciences, Other)
* Y-axis: % MMLU (0% to 40%)
* **Chart 4 (Bottom-Right):**
* X-axis: Disciplines (STEM, Humanities, Social Sciences, Other)
* Y-axis: AUROC ↑ (40% to 80%) - Note the upward arrow indicates a maximization goal.
### Detailed Analysis or Content Details
**Chart 1: % Train**
* STEM: Approximately 34%
* Humanities: Approximately 32%
* Social Sciences: Approximately 25%
* Other: Approximately 20%
**Chart 2: ECE ↓**
* STEM: Approximately 11% with error bars ranging from 9% to 13%
* Humanities: Approximately 12% with error bars ranging from 10% to 14%
* Social Sciences: Approximately 10% with error bars ranging from 8% to 12%
* Other: Approximately 10% with error bars ranging from 8% to 12%
**Chart 3: % MMLU**
* STEM: Approximately 34%
* Humanities: Approximately 25%
* Social Sciences: Approximately 20%
* Other: Approximately 16%
**Chart 4: AUROC ↑**
* STEM: Approximately 68% with error bars ranging from 64% to 72%
* Humanities: Approximately 70% with error bars ranging from 66% to 74%
* Social Sciences: Approximately 72% with error bars ranging from 68% to 76%
* Other: Approximately 74% with error bars ranging from 70% to 78%
### Key Observations
* STEM and Humanities consistently perform similarly across all metrics.
* Social Sciences and Other generally show lower performance than STEM and Humanities.
* ECE is minimized, while AUROC is maximized, as indicated by the arrows.
* Error bars suggest some variability in the ECE and AUROC metrics.
### Interpretation
The data suggests that STEM and Humanities disciplines generally outperform Social Sciences and Other disciplines in the evaluated metrics (% Train, ECE, % MMLU, and AUROC). The consistent performance of STEM and Humanities may indicate shared characteristics or methodologies. The minimization of ECE and maximization of AUROC are desirable outcomes, and the error bars indicate the reliability of these measurements. The differences in performance across disciplines could be due to variations in training data, model complexity, or inherent difficulty of the tasks. The "Other" category is consistently the lowest performing, suggesting it may encompass a diverse set of disciplines with varying levels of relevance to the evaluated metrics. The data could be used to identify areas for improvement in training or model development for Social Sciences and Other disciplines.