## Line Chart: Attention over Values, a=80
### Overview
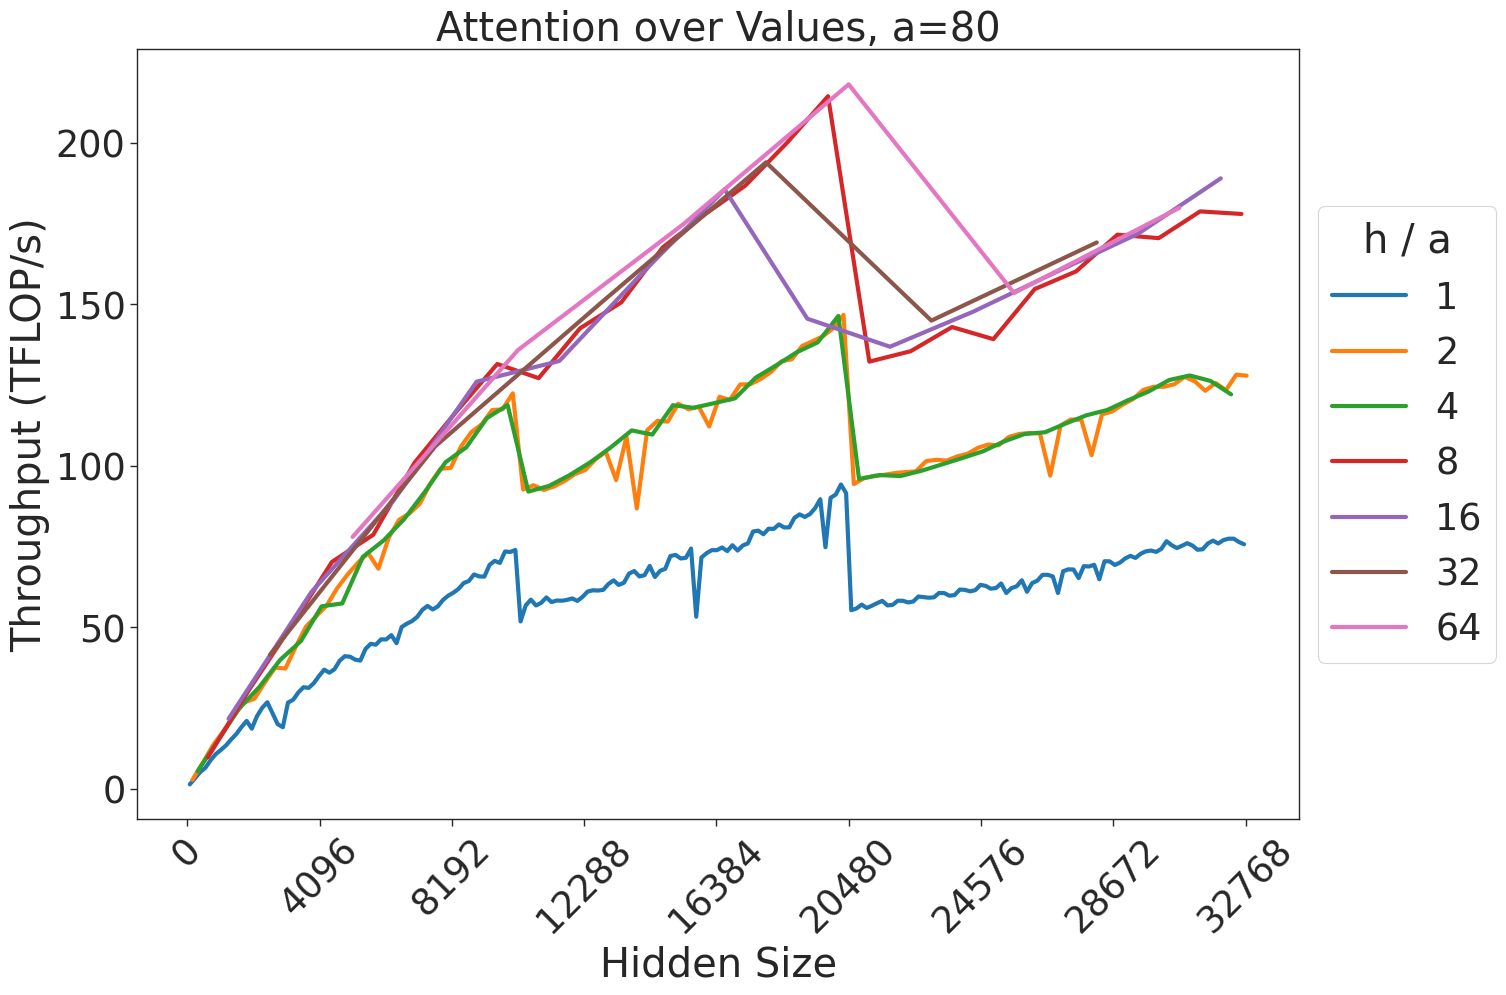
This image is a line chart titled "Attention over Values, a=80". It illustrates the relationship between "Hidden Size" (x-axis) and "Throughput (TFLOP/s)" (y-axis) across various "h/a" ratios (represented by different colored lines). The chart demonstrates how computational throughput scales with model size and how different head-to-attention-dimension ratios impact performance, including notable performance drops (sawtooth patterns) at specific hidden size intervals.
### Components/Axes
* **Title:** "Attention over Values, a=80" (Top center).
* **X-Axis:** Labeled "Hidden Size". The scale ranges from 0 to 32768. Major tick marks are provided at 0, 4096, 8192, 12288, 16384, 20480, 24576, 28672, and 32768.
* **Y-Axis:** Labeled "Throughput (TFLOP/s)". The scale ranges from 0 to slightly above 200. Major tick marks are provided at 0, 50, 100, 150, and 200.
* **Legend:** Located on the right side of the chart. It is titled "h / a" and maps colors to specific ratios:
* **Blue:** 1
* **Orange:** 2
* **Green:** 4
* **Red:** 8
* **Purple:** 16
* **Brown:** 32
* **Pink:** 64
### Detailed Analysis
The chart displays a general upward trend for all data series, indicating that throughput increases as the hidden size increases. However, all lines exhibit a "sawtooth" pattern, characterized by periodic, sharp drops in throughput followed by a resumption of the upward trend.
**Trend Verification & Data Points:**
* **General Trend:** All lines slope upward from the origin (0,0).
* **Sawtooth Drops:** There are consistent, sharp drops in throughput occurring at specific intervals, most notably around the 10,000 and 20,000 hidden size marks. These suggest kernel switching or memory alignment boundaries.
* **Series Groupings:**
* **Low Ratios (Blue, Orange, Green):**
* **Blue (h/a=1):** Consistently the lowest throughput, ending at approximately 75-80 TFLOP/s.
* **Orange (h/a=2) and Green (h/a=4):** These two lines are nearly identical, overlapping almost perfectly throughout the entire range. They reach approximately 125-130 TFLOP/s at the maximum hidden size.
* **High Ratios (Red, Purple, Brown, Pink):**
* **Red (h/a=8) and Purple (h/a=16):** These lines track closely together, generally outperforming the lower ratios. They end at approximately 175-190 TFLOP/s.
* **Brown (h/a=32) and Pink (h/a=64):** These lines achieve the highest throughput, peaking at over 200 TFLOP/s at a hidden size of 20,480.
* **The 20,480 Cliff:** Immediately following the 20,480 mark, both the Brown and Pink lines experience a dramatic, sharp drop in throughput (falling from >200 TFLOP/s to ~140-150 TFLOP/s). After this drop, they resume an upward trend, with the Pink line (64) recovering to approximately 190 TFLOP/s and the Brown line (32) recovering to approximately 175 TFLOP/s.
### Key Observations
* **Performance Ceiling/Cliff:** The most significant anomaly is the sharp performance degradation for the highest ratios (32 and 64) immediately after the hidden size of 20,480. This suggests a hard limit in the underlying implementation (e.g., shared memory capacity or register pressure) that is triggered at this specific size.
* **Redundancy:** The performance of h/a=2 and h/a=4 is indistinguishable, suggesting that within this specific implementation, increasing the ratio from 2 to 4 provides no throughput benefit.
* **Scaling Efficiency:** Higher h/a ratios generally yield higher throughput, but they are also more susceptible to the performance cliffs observed at the 20,480 mark.
### Interpretation
This chart is likely a performance benchmark for a GPU-accelerated attention mechanism (such as FlashAttention).
* **What the data demonstrates:** The "sawtooth" pattern is characteristic of GPU kernel execution where the implementation switches algorithms or tiling strategies based on the input size to optimize memory access.
* **Why it matters:** The sharp drop at 20,480 for high h/a ratios indicates a "performance cliff." For developers or researchers, this means that choosing a hidden size of 20,480 or slightly higher might be suboptimal for high-head-count models, as it forces the system into a less efficient execution path.
* **Reading between the lines:** The convergence of the Orange (2) and Green (4) lines suggests that the hardware/software is not utilizing the additional capacity provided by the higher ratio, or that the bottleneck is elsewhere (e.g., compute-bound vs. memory-bound). The fact that the Pink (64) and Brown (32) lines recover after the cliff suggests that the implementation is capable of handling larger sizes, but the transition at 20,480 is inefficient.