## Table: Operation Latency
### Overview
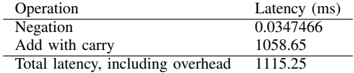
The image presents a table showing the latency (in milliseconds) for different operations. It includes the latency for negation, addition with carry, and the total latency including overhead.
### Components/Axes
* **Columns:**
* Operation
* Latency (ms)
* **Rows:**
* Negation
* Add with carry
* Total latency, including overhead
### Detailed Analysis
The table provides the following latency values:
* **Negation:** 0.0347466 ms
* **Add with carry:** 1058.65 ms
* **Total latency, including overhead:** 1115.25 ms
### Key Observations
* The "Add with carry" operation has a significantly higher latency compared to "Negation".
* The "Total latency, including overhead" is greater than the "Add with carry" latency, indicating that overhead contributes to the overall latency.
### Interpretation
The data suggests that the "Add with carry" operation is computationally more expensive than "Negation". The difference between the "Total latency" and the "Add with carry" latency (1115.25 - 1058.65 = 56.6 ms) represents the overhead associated with the operations. This overhead could include factors such as memory access, function call overhead, or other system-level processes. The table highlights the relative performance costs of different operations, which can be useful for optimizing code or hardware designs.