\n
## Chart: Test Loss vs. Parameters for Different Layer Depths
### Overview
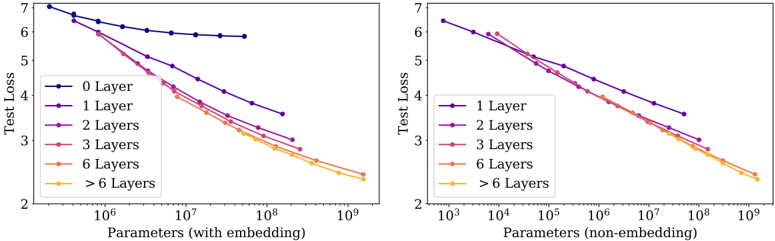
The image presents two line charts comparing the test loss of models with varying numbers of layers against the number of parameters. The left chart shows results for models *with embedding*, while the right chart shows results for models *without embedding*. Both charts use a logarithmic scale for the x-axis (Parameters).
### Components/Axes
* **X-axis (Both Charts):** Parameters. The left chart's scale ranges from approximately 10<sup>6</sup> to 10<sup>9</sup>. The right chart's scale ranges from approximately 10<sup>3</sup> to 10<sup>9</sup>.
* **Y-axis (Both Charts):** Test Loss. The scale ranges from approximately 2 to 7.
* **Left Chart Legend (Top-Left):**
* 0 Layer (Blue)
* 1 Layer (Purple)
* 2 Layers (Dark Red)
* 3 Layers (Orange)
* 6 Layers (Yellow)
* > 6 Layers (Brown)
* **Right Chart Legend (Top-Right):**
* 1 Layer (Purple)
* 2 Layers (Dark Red)
* 3 Layers (Orange)
* 6 Layers (Yellow)
* > 6 Layers (Brown)
### Detailed Analysis or Content Details
**Left Chart (With Embedding):**
* **0 Layer (Blue):** Starts at approximately 6.8 and remains relatively flat, decreasing slightly to around 6.2 at 10<sup>9</sup> parameters.
* **1 Layer (Purple):** Starts at approximately 6.8 and decreases steadily to around 3.8 at 10<sup>9</sup> parameters.
* **2 Layers (Dark Red):** Starts at approximately 6.5 and decreases more rapidly than the 1-layer model, reaching around 3.2 at 10<sup>9</sup> parameters.
* **3 Layers (Orange):** Starts at approximately 6.2 and decreases rapidly, reaching around 2.8 at 10<sup>9</sup> parameters.
* **6 Layers (Yellow):** Starts at approximately 5.5 and decreases very rapidly, reaching around 2.4 at 10<sup>9</sup> parameters.
* **> 6 Layers (Brown):** Starts at approximately 5.2 and decreases most rapidly, reaching around 2.2 at 10<sup>9</sup> parameters.
**Right Chart (Non-Embedding):**
* **1 Layer (Purple):** Starts at approximately 6.8 and decreases steadily to around 3.7 at 10<sup>9</sup> parameters.
* **2 Layers (Dark Red):** Starts at approximately 6.5 and decreases more rapidly than the 1-layer model, reaching around 3.1 at 10<sup>9</sup> parameters.
* **3 Layers (Orange):** Starts at approximately 6.2 and decreases rapidly, reaching around 2.7 at 10<sup>9</sup> parameters.
* **6 Layers (Yellow):** Starts at approximately 5.5 and decreases very rapidly, reaching around 2.3 at 10<sup>9</sup> parameters.
* **> 6 Layers (Brown):** Starts at approximately 5.2 and decreases most rapidly, reaching around 2.1 at 10<sup>9</sup> parameters.
### Key Observations
* In both charts, increasing the number of layers consistently reduces the test loss.
* The rate of loss reduction appears to diminish as the number of parameters increases, especially for models with more layers.
* The models with embedding (left chart) generally exhibit slightly higher test loss values compared to the models without embedding (right chart) for the same number of layers and parameters.
* The 0-layer model (left chart) shows minimal improvement in test loss with increasing parameters, suggesting it is not benefiting from increased model capacity.
### Interpretation
The data demonstrates a clear relationship between model complexity (number of layers) and performance (test loss). Increasing the number of layers generally leads to lower test loss, indicating improved model accuracy. However, the diminishing returns observed at higher parameter counts suggest that there is a point of saturation where adding more layers does not significantly improve performance.
The difference between the "with embedding" and "non-embedding" models suggests that embedding may provide a slight advantage in terms of test loss, but this advantage is not substantial. The 0-layer model's lack of improvement highlights the importance of model capacity for learning complex patterns.
The logarithmic scale on the x-axis emphasizes the impact of increasing parameters, particularly at lower values. The charts provide valuable insights into the trade-offs between model complexity, parameter count, and performance, which can inform model design and optimization strategies. The consistent downward trend for all layer counts suggests that increasing model size is generally beneficial, but careful consideration should be given to the point of diminishing returns and the potential benefits of embedding techniques.