## Bar Chart: Prediction Flip Rate Comparison
### Overview
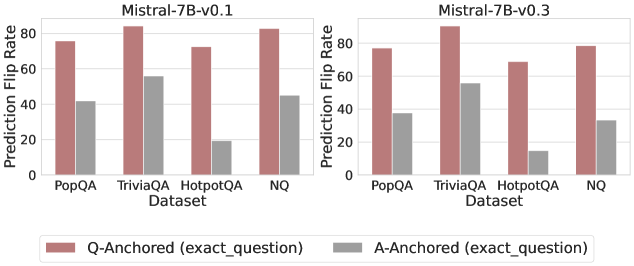
The image presents two bar charts comparing the prediction flip rates of two versions of the Mistral-7B model (v0.1 and v0.3) across different datasets. The charts show the prediction flip rates for both Q-Anchored (exact_question) and A-Anchored (exact_question) methods.
### Components/Axes
* **Titles:**
* Left Chart: Mistral-7B-v0.1
* Right Chart: Mistral-7B-v0.3
* **Y-axis:** Prediction Flip Rate
* Scale: 0 to 80, with tick marks at 0, 20, 40, 60, and 80.
* **X-axis:** Dataset
* Categories: PopQA, TriviaQA, HotpotQA, NQ
* **Legend:** Located at the bottom of the image.
* Q-Anchored (exact\_question): Represented by a muted red/brown color.
* A-Anchored (exact\_question): Represented by a gray color.
### Detailed Analysis
**Left Chart: Mistral-7B-v0.1**
* **PopQA:**
* Q-Anchored: Approximately 76
* A-Anchored: Approximately 42
* **TriviaQA:**
* Q-Anchored: Approximately 84
* A-Anchored: Approximately 56
* **HotpotQA:**
* Q-Anchored: Approximately 72
* A-Anchored: Approximately 20
* **NQ:**
* Q-Anchored: Approximately 78
* A-Anchored: Approximately 58
**Right Chart: Mistral-7B-v0.3**
* **PopQA:**
* Q-Anchored: Approximately 76
* A-Anchored: Approximately 38
* **TriviaQA:**
* Q-Anchored: Approximately 86
* A-Anchored: Approximately 56
* **HotpotQA:**
* Q-Anchored: Approximately 72
* A-Anchored: Approximately 14
* **NQ:**
* Q-Anchored: Approximately 78
* A-Anchored: Approximately 32
### Key Observations
* In both charts, the Q-Anchored method consistently shows a higher prediction flip rate than the A-Anchored method across all datasets.
* The TriviaQA dataset generally has the highest prediction flip rate for the Q-Anchored method in both versions.
* The HotpotQA dataset has the lowest prediction flip rate for the A-Anchored method in both versions.
* Comparing the two versions, the A-Anchored method shows a decrease in prediction flip rate for HotpotQA and NQ in v0.3 compared to v0.1.
### Interpretation
The data suggests that anchoring the question (Q-Anchored) leads to a higher prediction flip rate compared to anchoring the answer (A-Anchored) for both versions of the Mistral-7B model. This could indicate that the model is more sensitive to changes or perturbations in the question than in the answer. The decrease in prediction flip rate for the A-Anchored method in v0.3 for HotpotQA and NQ datasets might indicate an improvement in the model's robustness to answer-related perturbations for those specific datasets. The consistent high flip rate for Q-Anchored TriviaQA suggests that this dataset might be particularly challenging for the model in terms of question understanding or robustness.