\n
## Diagram: Large Language Model Evolution Timeline
### Overview
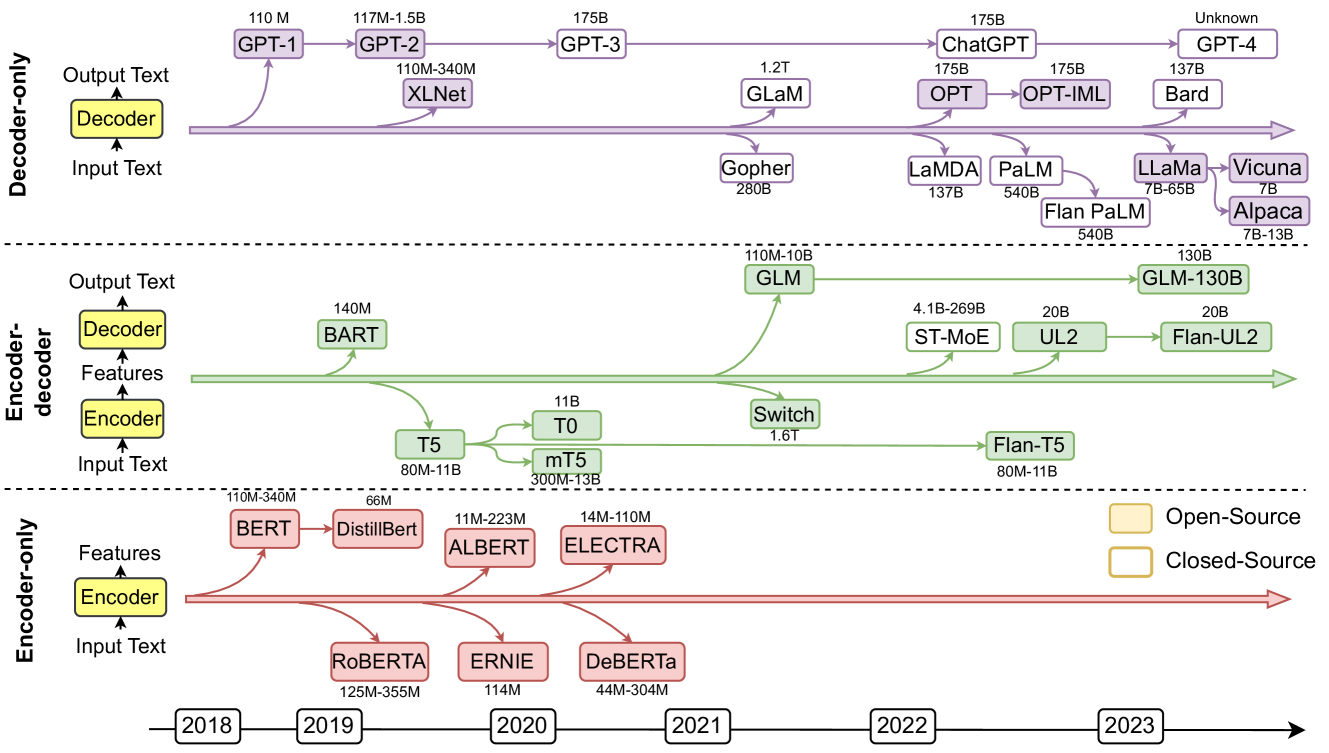
This diagram presents a timeline of the evolution of large language models (LLMs) from 2018 to 2023. The models are categorized by their architecture (Decoder-only, Encoder-decoder, Encoder-only) and are positioned along a horizontal timeline. Each model is represented by a colored box, indicating whether it is open-source or closed-source. The size of each model (in millions or billions of parameters) is indicated within the box. Green lines represent the progression of open-source models, while purple lines represent closed-source models.
### Components/Axes
* **Vertical Axis:** Represents the model architecture: Decoder-only (top), Encoder-decoder (middle), Encoder-only (bottom). Each architecture has a simplified diagram showing the flow of "Input Text", "Features", and "Output Text".
* **Horizontal Axis:** Represents time, spanning from 2018 to 2023, with year markers along the bottom.
* **Legend (Bottom-Right):**
* Green: Open-Source
* Yellow: Closed-Source
* **Model Boxes:** Each box contains the model name and its size in parameters (e.g., "110M", "1.2T").
* **Connecting Lines:** Green and purple lines connect models, indicating a progression or relationship.
### Detailed Analysis or Content Details
**Encoder-only Models (Bottom Row):**
* **2018:** BERT (110M-340M) - Yellow (Closed-Source)
* **2019:** RoBERTa (125M-355M) - Yellow (Closed-Source)
* **2019:** ALBERT (11M-223M) - Green (Open-Source)
* **2020:** DistilBERT (66M) - Green (Open-Source)
* **2020:** ELECTRA (14M-110M) - Green (Open-Source)
* **2020:** DeBERTa (44M-304M) - Yellow (Closed-Source)
**Encoder-decoder Models (Middle Row):**
* **2019:** BART (140M) - Yellow (Closed-Source)
* **2020:** T5 (80M-11B) - Green (Open-Source)
* **2020:** mT5 (300M-13B) - Green (Open-Source)
* **2021:** GLM (110M-10B) - Yellow (Closed-Source)
* **2021:** Switch (1.6T) - Yellow (Closed-Source)
* **2022:** ST-MoE (4.1B-269B) - Yellow (Closed-Source)
* **2022:** UL2 (20B) - Yellow (Closed-Source)
* **2022:** Flan-UL2 (20B) - Yellow (Closed-Source)
* **2023:** Flan-T5 (80M-11B) - Green (Open-Source)
**Decoder-only Models (Top Row):**
* **2018:** GPT-1 (110M) - Yellow (Closed-Source)
* **2019:** GPT-2 (117M-1.5B) - Yellow (Closed-Source)
* **2020:** GPT-3 (175B) - Yellow (Closed-Source)
* **2020:** XLNet (110M-340M) - Yellow (Closed-Source)
* **2021:** GLaM (1.2T) - Yellow (Closed-Source)
* **2022:** OPT (175B) - Green (Open-Source)
* **2022:** ChatGPT (175B) - Yellow (Closed-Source)
* **2022:** OPT-IML (175B) - Green (Open-Source)
* **2022:** LaMDA (137B) - Yellow (Closed-Source)
* **2022:** PaLM (540B) - Yellow (Closed-Source)
* **2023:** LLaMa (7B-65B) - Green (Open-Source)
* **2023:** Vicuna (7B-13B) - Green (Open-Source)
* **2023:** Alpaca (7B) - Green (Open-Source)
* **2023:** GPT-4 (Unknown) - Yellow (Closed-Source)
* **2023:** Bard (137B) - Yellow (Closed-Source)
### Key Observations
* The trend shows a significant increase in model size (parameter count) over time across all architectures.
* Initially, most models were closed-source, but there's a growing trend towards open-source models, particularly in recent years (2022-2023).
* Decoder-only models have seen the most rapid growth in size, culminating in GPT-4 with an unknown parameter count.
* The diagram highlights the parallel development of different architectures (Encoder-only, Encoder-decoder, Decoder-only).
* The lines connecting models suggest a lineage or influence, but the exact nature of these relationships isn't explicitly stated.
### Interpretation
The diagram illustrates the rapid advancement in the field of large language models. The increasing model size suggests a pursuit of greater capacity and performance. The shift towards open-source models indicates a democratization of access to this technology, fostering innovation and collaboration. The parallel development of different architectures suggests that researchers are exploring various approaches to achieve optimal results. The diagram serves as a valuable snapshot of the LLM landscape, highlighting key milestones and trends. The unknown parameter count for GPT-4 suggests that it represents a significant leap forward, potentially exceeding the capabilities of its predecessors. The diagram doesn't provide information on the performance of these models, only their size and architecture. It's a high-level overview, focusing on the evolution of the models themselves rather than their applications or impact. The diagram implies a competitive landscape, with both open-source and closed-source models vying for dominance. The lines connecting the models suggest that new models are often built upon or inspired by previous work.