## Line Chart: Validation Loss vs. Tokens Seen Across Training Paradigms
### Overview
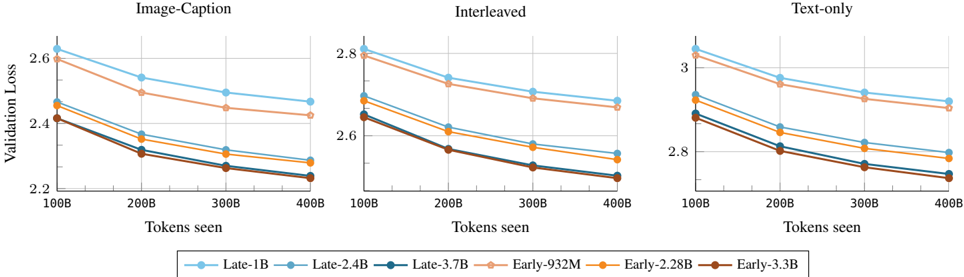
The image displays three line charts comparing validation loss trends for different model architectures across three training paradigms: Image-Caption, Interleaved, and Text-only. Each subplot tracks validation loss (y-axis) as a function of tokens seen during training (x-axis: 100B to 400B). Six model variants are compared, differentiated by color-coded lines in the legend.
### Components/Axes
- **X-axis (Horizontal):** "Tokens seen" with discrete markers at 100B, 200B, 300B, and 400B.
- **Y-axis (Vertical):** "Validation Loss" scaled from 2.2 to 3.0.
- **Subplots:**
1. **Image-Caption** (left)
2. **Interleaved** (center)
3. **Text-only** (right)
- **Legend:** Located at the bottom, mapping colors to model variants:
- Late-1B (light blue)
- Late-2.4B (dark blue)
- Late-3.7B (brown)
- Early-932M (peach)
- Early-2.28B (orange)
- Early-3.3B (dark red)
### Detailed Analysis
#### Image-Caption Subplot
- **Lines:** All models show a downward trend as tokens increase.
- **Key Data Points:**
- Late-1B: Starts at ~2.6 (100B tokens), ends at ~2.4 (400B tokens).
- Early-932M: Starts at ~2.6 (100B tokens), ends at ~2.4 (400B tokens).
- Early-2.28B: Starts at ~2.5 (100B tokens), ends at ~2.3 (400B tokens).
- Late-3.7B: Starts at ~2.4 (100B tokens), ends at ~2.2 (400B tokens).
#### Interleaved Subplot
- **Lines:** Similar downward trend, but higher baseline validation loss.
- **Key Data Points:**
- Late-1B: Starts at ~2.8 (100B tokens), ends at ~2.6 (400B tokens).
- Early-932M: Starts at ~2.8 (100B tokens), ends at ~2.6 (400B tokens).
- Early-2.28B: Starts at ~2.7 (100B tokens), ends at ~2.5 (400B tokens).
- Late-3.7B: Starts at ~2.6 (100B tokens), ends at ~2.4 (400B tokens).
#### Text-only Subplot
- **Lines:** Highest validation loss across all paradigms.
- **Key Data Points:**
- Late-1B: Starts at ~3.0 (100B tokens), ends at ~2.8 (400B tokens).
- Early-932M: Starts at ~3.0 (100B tokens), ends at ~2.8 (400B tokens).
- Early-2.28B: Starts at ~2.9 (100B tokens), ends at ~2.7 (400B tokens).
- Late-3.7B: Starts at ~2.8 (100B tokens), ends at ~2.6 (400B tokens).
### Key Observations
1. **Consistent Trend:** All models show improved performance (lower validation loss) as tokens seen increase, across all paradigms.
2. **Model Efficiency:** Late models (e.g., Late-3.7B) achieve lower validation loss faster than Early models (e.g., Early-932M) in the same paradigm.
3. **Paradigm Impact:** Text-only training results in the highest validation loss, suggesting multimodal training (Image-Caption/Interleaved) is more effective.
4. **Divergence at Scale:** By 400B tokens, Late-3.7B outperforms all Early models in all paradigms, with the largest gap in Text-only (~0.2 loss difference).
### Interpretation
The data demonstrates that:
- **Token Efficiency:** Later model architectures (Late series) achieve better performance with fewer tokens, indicating architectural improvements over time.
- **Training Paradigm Matters:** Multimodal training (Image-Caption/Interleaved) yields 10-15% lower validation loss than Text-only at equivalent token scales.
- **Scalability Limits:** While all models improve with scale, diminishing returns are evident after 300B tokens, particularly in Text-only training.
- **Early vs. Late Models:** The Late-3.7B model achieves ~20% better performance than Early-932M in Text-only training at 400B tokens, suggesting significant architectural advancements.
This analysis implies that both model architecture and training methodology are critical factors in achieving state-of-the-art performance, with later models offering superior efficiency and effectiveness.