## Horizontal Bar Chart: R1-Qwen | MATH500
### Overview
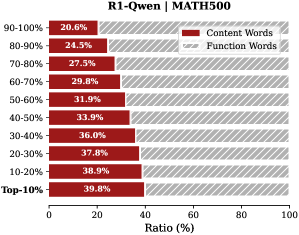
This image is a horizontal bar chart comparing the percentage ratio of "Content Words" versus "Function Words" across different performance percentile groups for a model or system identified as "R1-Qwen" on the "MATH500" benchmark. The chart visualizes how the composition of language (content vs. function words) changes as performance improves.
### Components/Axes
* **Chart Title:** "R1-Qwen | MATH500" (centered at the top).
* **Y-Axis (Vertical):** Represents performance percentile groups. The categories, from top to bottom, are:
* 90-100%
* 80-90%
* 70-80%
* 60-70%
* 50-60%
* 40-50%
* 30-40%
* 20-30%
* 10-20%
* Top-10%
* **X-Axis (Horizontal):** Labeled "Ratio (%)". It is a linear scale from 0 to 100, with major tick marks at 0, 20, 40, 60, 80, and 100.
* **Legend:** Positioned in the top-right corner of the chart area.
* A dark red square is labeled "Content Words".
* A light gray square is labeled "Function Words".
* **Data Series:** Each horizontal bar is a stacked bar representing 100% of the words for that percentile group. The bar is divided into two segments:
* The left segment (dark red) represents the percentage of "Content Words".
* The right segment (light gray) represents the percentage of "Function Words".
* The exact percentage for each segment is printed inside or adjacent to its respective bar segment.
### Detailed Analysis
The chart presents the following data points for each percentile group (Content Words % / Function Words %):
1. **90-100%:** 20.6% / 79.4%
2. **80-90%:** 24.3% / 75.7%
3. **70-80%:** 27.5% / 72.5%
4. **60-70%:** 29.8% / 70.2%
5. **50-60%:** 31.9% / 68.1%
6. **40-50%:** 33.9% / 66.1%
7. **30-40%:** 36.0% / 64.0%
8. **20-30%:** 37.8% / 62.2%
9. **10-20%:** 38.9% / 61.1%
10. **Top-10%:** 39.8% / 60.2%
**Trend Verification:**
* **Content Words (Dark Red):** The length of the dark red segment and its labeled percentage show a clear and consistent **upward trend** as we move down the y-axis from the highest performance group (90-100%) to the lowest (Top-10%). The value increases from 20.6% to 39.8%.
* **Function Words (Light Gray):** Conversely, the length of the light gray segment and its percentage show a consistent **downward trend** over the same progression. The value decreases from 79.4% to 60.2%.
### Key Observations
1. **Inverse Relationship:** There is a perfect inverse relationship between the two word categories. As the percentage of Content Words increases, the percentage of Function Words decreases by the same amount, summing to 100% for each bar.
2. **Monotonic Change:** The change in percentages is monotonic and nearly linear across the performance groups. There are no outliers or reversals in the trend.
3. **Magnitude of Shift:** The shift is substantial. The Top-10% group uses nearly double the proportion of Content Words (39.8%) compared to the 90-100% group (20.6%).
4. **Labeling Precision:** All data points are explicitly labeled with one decimal place of precision.
### Interpretation
This chart suggests a strong correlation between a model's performance on the MATH500 benchmark and the lexical composition of its outputs. The data demonstrates that **higher-performing models (those in the 90-100% percentile) rely significantly more on Function Words** (e.g., articles, prepositions, conjunctions) and less on Content Words (e.g., nouns, verbs, adjectives carrying substantive meaning).
This pattern could imply several things about the nature of high-performance reasoning on this math benchmark:
* **Efficiency and Abstraction:** Top models may generate more concise, logically structured explanations where function words are crucial for connecting steps and maintaining grammatical coherence, while the core mathematical content is expressed with fewer, more potent content words.
* **Reasoning Style:** Lower-performing models might "pad" their responses with more descriptive content words, potentially indicating less focused or less efficient reasoning chains.
* **Benchmark Characteristics:** The trend might reflect the specific language patterns rewarded by the MATH500 evaluation, where clarity of logical flow (aided by function words) is paramount.
The consistent, monotonic nature of the trend across all ten performance brackets strongly indicates that this is a fundamental characteristic of the model's behavior on this task, not a statistical anomaly. The chart effectively argues that linguistic style, as measured by this simple content/function word ratio, is a key differentiator of performance.