## Heatmaps: Reynolds Stress Components in Wall-Bounded Turbulence
### Overview
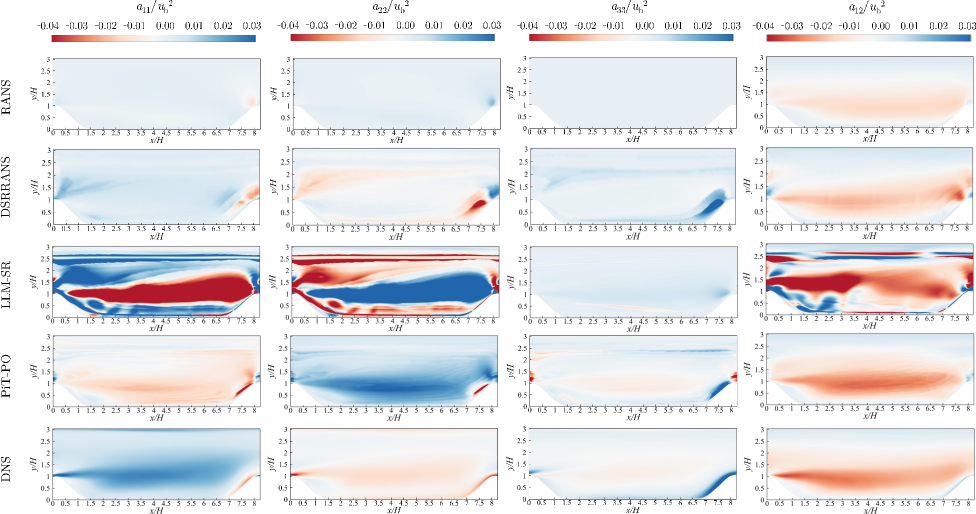
The image presents a 5x4 grid of heatmaps, visualizing Reynolds stress components normalized by the square of the friction velocity (uτ²). Each row represents a different turbulence model or dataset (DNS, DSRRANS, LLM-SR, PIT-PO), and each column represents a different Reynolds stress component (a₁₁, a₂₂, a₁₂, a₂₁). The heatmaps display the normalized Reynolds stress components as a function of wall-normal distance (y⁺/h) and streamwise distance (x/H).
### Components/Axes
* **Rows:** DNS (Direct Numerical Simulation), DSRRANS (Dynamic Subgrid Reynolds-Averaged Navier-Stokes), LLM-SR (Large Eddy Model - Scale-Resolved), PIT-PO (Piterbarg-Type One-Equation Model)
* **Columns:** a₁₁/uτ², a₂₂/uτ², a₁₂/uτ², a₂₁/uτ² (Reynolds stress components)
* **X-axis:** x/H (Streamwise distance, ranging from approximately 0 to 7.5)
* **Y-axis:** y⁺/h (Wall-normal distance, ranging from approximately 0 to 2.5)
* **Color Scale:** Ranges from -0.04 to 0.03, with blue representing negative values and red representing positive values. The colorbar increments are 0.004.
### Detailed Analysis or Content Details
**Row 1: DNS**
* **a₁₁/uτ²:** The heatmap shows a generally positive trend, with higher values near the wall (y⁺/h ≈ 0) and decreasing values as y⁺/h increases. Values range from approximately -0.01 to 0.02. A slight undulation is visible along the x/H axis.
* **a₂₂/uτ²:** Similar to a₁₁, this heatmap shows positive values near the wall, decreasing with increasing y⁺/h. Values range from approximately -0.02 to 0.01.
* **a₁₂/uτ²:** Displays a strong negative region near the wall, transitioning to a positive region further away from the wall. Values range from approximately -0.03 to 0.01.
* **a₂₁/uτ²:** Mirrors the pattern of a₁₂ with a strong positive region near the wall and a negative region further away. Values range from approximately -0.02 to 0.02.
**Row 2: DSRRANS**
* **a₁₁/uτ²:** Shows a broad positive region, but with less pronounced variation than DNS. Values range from approximately -0.01 to 0.02.
* **a₂₂/uτ²:** Similar to a₁₁, with a broad positive region. Values range from approximately -0.01 to 0.02.
* **a₁₂/uτ²:** Displays a negative region near the wall, but less defined than in DNS. Values range from approximately -0.02 to 0.01.
* **a₂₁/uτ²:** Mirrors a₁₂, but with less definition. Values range from approximately -0.02 to 0.01.
**Row 3: LLM-SR**
* **a₁₁/uτ²:** Shows a strong positive region near the wall, with a more pronounced peak than DNS. Values range from approximately -0.01 to 0.03.
* **a₂₂/uτ²:** Similar to a₁₁, with a strong positive region. Values range from approximately -0.01 to 0.03.
* **a₁₂/uτ²:** Displays a clear negative region near the wall, transitioning to positive values. Values range from approximately -0.03 to 0.02.
* **a₂₁/uτ²:** Mirrors a₁₂, with a clear negative region near the wall. Values range from approximately -0.03 to 0.02.
**Row 4: PIT-PO**
* **a₁₁/uτ²:** Shows a positive region near the wall, but with less variation than DNS. Values range from approximately -0.01 to 0.02.
* **a₂₂/uτ²:** Similar to a₁₁, with a positive region. Values range from approximately -0.01 to 0.02.
* **a₁₂/uτ²:** Displays a negative region near the wall, but less defined than in DNS. Values range from approximately -0.02 to 0.01.
* **a₂₁/uτ²:** Mirrors a₁₂, but with less definition. Values range from approximately -0.02 to 0.01.
**Row 5: DNS**
* **a₁₁/uτ²:** The heatmap shows a generally positive trend, with higher values near the wall (y⁺/h ≈ 0) and decreasing values as y⁺/h increases. Values range from approximately -0.01 to 0.02. A slight undulation is visible along the x/H axis.
* **a₂₂/uτ²:** Similar to a₁₁, this heatmap shows positive values near the wall, decreasing with increasing y⁺/h. Values range from approximately -0.02 to 0.01.
* **a₁₂/uτ²:** Displays a strong negative region near the wall, transitioning to a positive region further away from the wall. Values range from approximately -0.03 to 0.01.
* **a₂₁/uτ²:** Mirrors the pattern of a₁₂ with a strong positive region near the wall and a negative region further away. Values range from approximately -0.02 to 0.02.
### Key Observations
* DNS consistently shows the most detailed and complex patterns in the Reynolds stress components.
* DSRRANS and PIT-PO exhibit smoother distributions, suggesting a loss of fine-scale information.
* LLM-SR captures some of the complexity of DNS, particularly in the near-wall region.
* The a₁₂ and a₂₁ components consistently show a sign change with increasing wall-normal distance.
* The magnitude of the Reynolds stresses generally decreases with increasing wall-normal distance.
### Interpretation
The heatmaps illustrate the differences in how various turbulence models represent Reynolds stresses in wall-bounded turbulent flows. DNS, being the most computationally expensive but accurate method, serves as a benchmark. The other models (DSRRANS, LLM-SR, and PIT-PO) attempt to approximate the DNS results with varying degrees of fidelity and computational cost.
The smoother distributions observed in DSRRANS and PIT-PO suggest that these models may not fully resolve the small-scale turbulent structures that contribute significantly to Reynolds stresses. LLM-SR, as a scale-resolved model, appears to capture more of the DNS complexity, particularly in the near-wall region where the Reynolds stresses are highest.
The consistent sign change in a₁₂ and a₂₁ indicates the transfer of momentum between the different flow directions. The magnitude of these stresses reflects the intensity of this momentum transfer. The differences in the magnitude and distribution of these stresses between the models highlight the challenges in accurately modeling turbulent flows and the importance of choosing an appropriate model based on the specific application and available computational resources. The repeated DNS row suggests a possible error in the image or a deliberate comparison of two DNS runs.