## Line Chart: Validation Loss vs. Image Resolution (Two Subplots)
### Overview
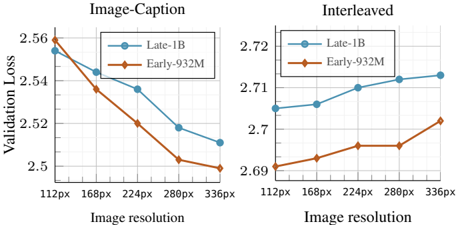
The image contains two side-by-side line charts comparing validation loss trends for two models ("Late-1B" and "Early-932M") across increasing image resolutions (112px to 336px). The left chart is labeled "Image-Caption," and the right chart is labeled "Interleaved." Both charts use a y-axis for validation loss (2.5–2.72) and an x-axis for image resolution.
---
### Components/Axes
- **X-Axis (Horizontal)**:
- Label: "Image resolution"
- Categories: 112px, 168px, 224px, 280px, 336px
- Scale: Linear progression of pixel values.
- **Y-Axis (Vertical)**:
- Label: "Validation Loss"
- Range: 2.5 to 2.72 (with gridlines at 0.01 increments).
- **Legends**:
- **Top-right of each chart**:
- Blue circles: "Late-1B"
- Orange diamonds: "Early-932M"
- **Subplot Titles**:
- Left: "Image-Caption"
- Right: "Interleaved"
---
### Detailed Analysis
#### Left Chart ("Image-Caption")
- **Late-1B (Blue)**:
- Starts at **2.56** (112px) and decreases steadily to **2.51** (336px).
- Trend: Consistent downward slope.
- **Early-932M (Orange)**:
- Starts at **2.56** (112px) and decreases to **2.50** (336px).
- Trend: Steeper decline than Late-1B.
#### Right Chart ("Interleaved")
- **Late-1B (Blue)**:
- Starts at **2.71** (112px) and increases slightly to **2.72** (336px).
- Trend: Gradual upward slope.
- **Early-932M (Orange)**:
- Starts at **2.69** (112px), rises to **2.70** (224px), then dips to **2.71** (336px).
- Trend: U-shaped curve with a peak at 224px.
---
### Key Observations
1. **Image-Caption Subplot**:
- Both models show improved performance (lower validation loss) as resolution increases.
- Early-932M outperforms Late-1B across all resolutions.
2. **Interleaved Subplot**:
- Late-1B’s performance degrades slightly with higher resolutions.
- Early-932M exhibits non-linear behavior, worsening at 224px before recovering.
3. **Model Behavior**:
- Early-932M generally achieves lower validation loss than Late-1B in both subplots.
- Resolution impacts differ significantly between tasks ("Image-Caption" vs. "Interleaved").
---
### Interpretation
- **Task-Specific Performance**:
- In "Image-Caption," higher resolutions benefit both models, suggesting scalability for simpler tasks.
- In "Interleaved," increased resolution introduces complexity, causing Late-1B to underperform and Early-932M to show instability at mid-resolutions.
- **Model Efficiency**:
- Early-932M’s architecture may better handle resolution-dependent tasks, but its performance in "Interleaved" hints at potential overfitting or sensitivity to input variability.
- **Anomalies**:
- The U-shaped curve for Early-932M in "Interleaved" suggests an optimal resolution range (168px–280px), beyond which validation loss increases again.
This analysis highlights the importance of resolution tuning for model deployment, particularly in complex tasks like "Interleaved," where higher resolution does not always correlate with better performance.