## Line Chart: Proportion vs. Step for Gather and Aggregate
### Overview
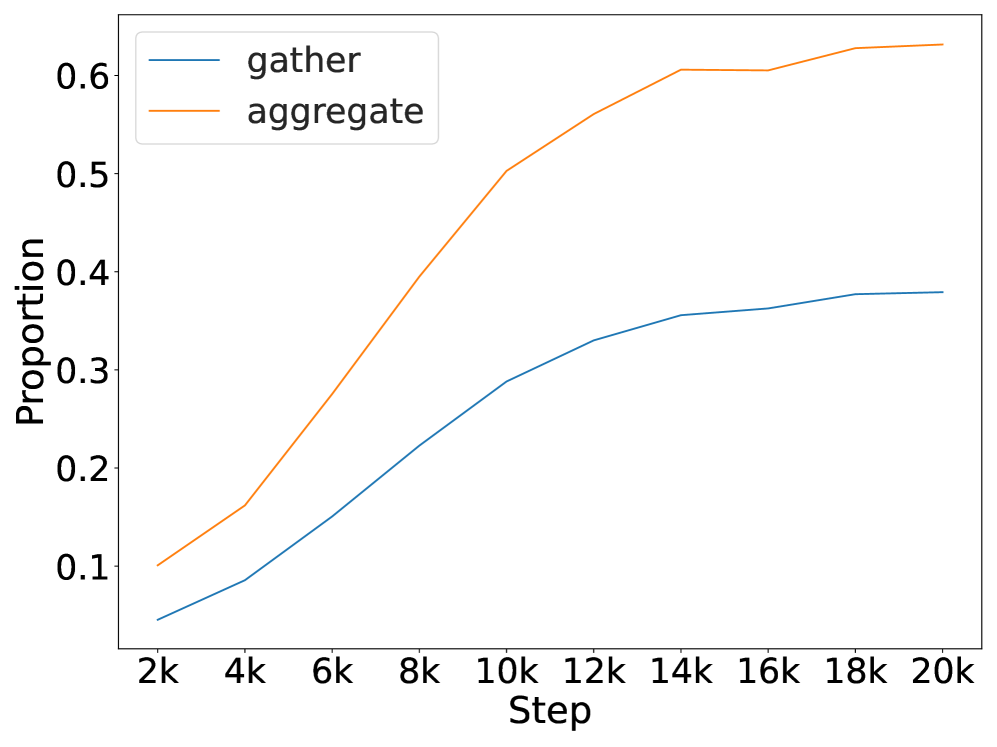
The image is a line chart comparing the "Proportion" of two processes, "gather" and "aggregate," over a range of "Step" values. The chart displays how the proportion changes for each process as the step increases.
### Components/Axes
* **X-axis (Horizontal):** "Step" - Ranges from 2k to 20k in increments of 2k (2k, 4k, 6k, 8k, 10k, 12k, 14k, 16k, 18k, 20k).
* **Y-axis (Vertical):** "Proportion" - Ranges from 0.1 to 0.6 in increments of 0.1 (0.1, 0.2, 0.3, 0.4, 0.5, 0.6).
* **Legend (Top-Left):**
* "gather" - Represented by a dark teal line.
* "aggregate" - Represented by an orange line.
### Detailed Analysis
* **"gather" (Dark Teal Line):**
* Trend: The proportion increases as the step increases, but the rate of increase slows down as the step gets larger.
* Data Points:
* At 2k Step: Proportion is approximately 0.05.
* At 4k Step: Proportion is approximately 0.08.
* At 6k Step: Proportion is approximately 0.15.
* At 8k Step: Proportion is approximately 0.22.
* At 10k Step: Proportion is approximately 0.29.
* At 12k Step: Proportion is approximately 0.33.
* At 14k Step: Proportion is approximately 0.35.
* At 16k Step: Proportion is approximately 0.36.
* At 18k Step: Proportion is approximately 0.37.
* At 20k Step: Proportion is approximately 0.38.
* **"aggregate" (Orange Line):**
* Trend: The proportion increases as the step increases, but the rate of increase slows down as the step gets larger.
* Data Points:
* At 2k Step: Proportion is approximately 0.10.
* At 4k Step: Proportion is approximately 0.16.
* At 6k Step: Proportion is approximately 0.28.
* At 8k Step: Proportion is approximately 0.40.
* At 10k Step: Proportion is approximately 0.50.
* At 12k Step: Proportion is approximately 0.57.
* At 14k Step: Proportion is approximately 0.60.
* At 16k Step: Proportion is approximately 0.60.
* At 18k Step: Proportion is approximately 0.62.
* At 20k Step: Proportion is approximately 0.63.
### Key Observations
* The "aggregate" process consistently has a higher proportion than the "gather" process across all step values.
* Both processes show a diminishing rate of increase in proportion as the step value increases, suggesting a saturation effect.
* The "aggregate" process plateaus around a proportion of 0.60 after a step value of 14k.
* The "gather" process plateaus around a proportion of 0.38 after a step value of 18k.
### Interpretation
The chart suggests that the "aggregate" process is more effective in achieving a higher proportion compared to the "gather" process, given the same number of steps. The diminishing returns observed for both processes indicate that increasing the step value beyond a certain point may not significantly improve the proportion. The "aggregate" process appears to reach its maximum potential earlier than the "gather" process. This information could be valuable for optimizing resource allocation or process selection based on the desired proportion and step constraints.