## Line Graph: Proportion of "gather" and "aggregate" over Steps
### Overview
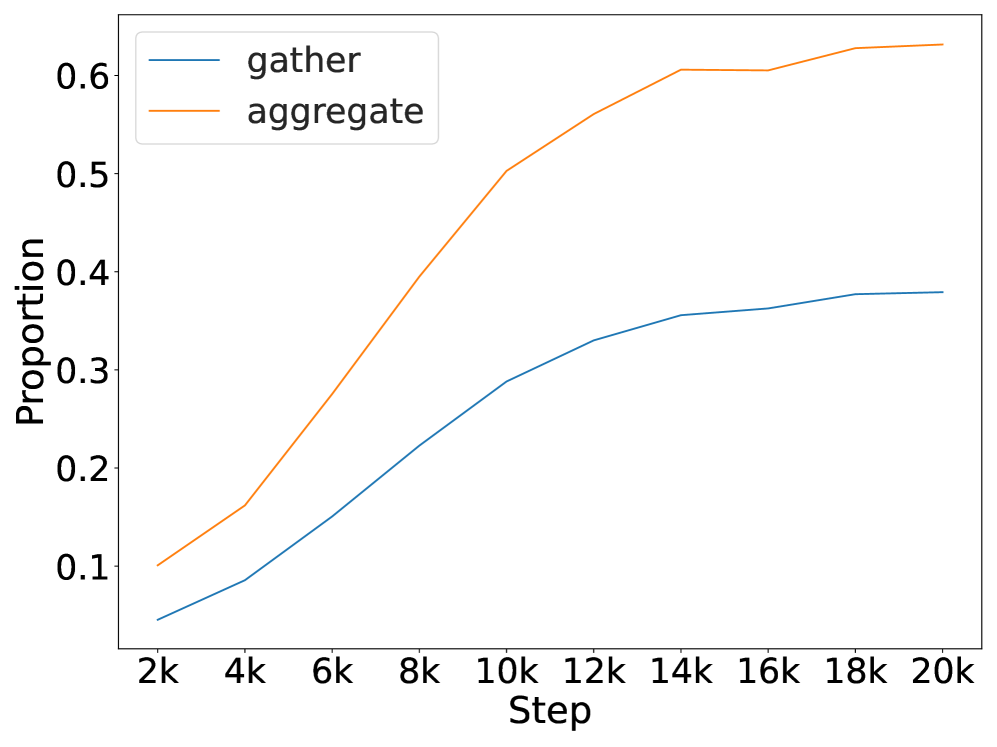
The image is a line graph comparing the proportion of two processes ("gather" and "aggregate") across incremental steps (2k to 20k). The graph shows two upward-trending lines, with "aggregate" consistently outperforming "gather" in proportion values.
### Components/Axes
- **X-axis (Step)**: Labeled "Step" with markers at 2k, 4k, 6k, ..., 20k (increments of 2k).
- **Y-axis (Proportion)**: Labeled "Proportion" with markers at 0.1, 0.2, ..., 0.6.
- **Legend**: Located in the top-left corner, with:
- Blue line labeled "gather"
- Orange line labeled "aggregate"
### Detailed Analysis
1. **Line Trends**:
- **Aggregate (Orange)**:
- Starts at ~0.1 at 2k.
- Rises sharply to ~0.62 by 20k.
- Slope is steeper than "gather".
- **Gather (Blue)**:
- Starts at ~0.05 at 2k.
- Increases gradually to ~0.38 by 20k.
- Slope is less steep than "aggregate".
2. **Key Data Points**:
- At 10k steps:
- Aggregate: ~0.5
- Gather: ~0.3
- At 14k steps:
- Aggregate: ~0.6
- Gather: ~0.35
- At 20k steps:
- Aggregate: ~0.62
- Gather: ~0.38
### Key Observations
- **Consistent Outperformance**: "Aggregate" maintains a higher proportion than "gather" across all steps.
- **Acceleration**: Both lines show increasing trends, but "aggregate" accelerates more rapidly.
- **Convergence Gap**: The proportional gap between the two lines narrows slightly at higher steps (e.g., 0.24 difference at 20k vs. 0.25 at 10k).
### Interpretation
The graph suggests that the "aggregate" process is more efficient or effective than "gather" in terms of proportion over time. The steeper slope of "aggregate" implies faster growth or higher throughput. The narrowing gap at higher steps could indicate diminishing returns for "aggregate" or saturation effects. This might reflect a comparison of data processing methods, resource allocation strategies, or workflow optimizations in a technical system. The lack of error bars or confidence intervals limits conclusions about statistical significance.