# Technical Data Extraction: Control Effect Analysis (Layer 28)
This document provides a comprehensive extraction of data from a multi-panel figure analyzing "Control effect (d)" across various target and affected axes in a neural network context (specifically Layer 28).
## 1. Document Structure Overview
The image is divided into two primary sections:
- **Left Section (Line Charts):** Eight individual line graphs showing the progression of control effects over the number of examples.
- **Right Section (Heatmap):** A summary matrix showing the final control effect values for different axis pairings.
---
## 2. Component Isolation: Line Charts (Left Section)
### General Metadata for Line Charts
- **X-axis (all):** `# Examples` (Scale: 0 to 250).
- **Y-axis (all):** `Control effect (d)`.
- **Legend (Affected axis):**
- **LR:** Solid Red line.
- **PC1:** Dotted Yellow line.
- **PC2:** Dotted Light Green line.
- **PC4:** Dotted Teal/Green line.
- **PC8:** Dotted Blue-Green line.
- **PC32:** Dotted Blue line.
- **PC128:** Dotted Dark Blue line.
- **PC512:** Dotted Purple line.
- **Visual Note:** Solid lines indicate the "Target axis" matches the "Affected axis" (Self-influence). Dotted lines indicate cross-axis influence. Shaded areas represent confidence intervals or variance.
### Individual Chart Data Extraction
| Target Axis | Primary Trend (Self-Influence) | Cross-Axis Observations |
| :--- | :--- | :--- |
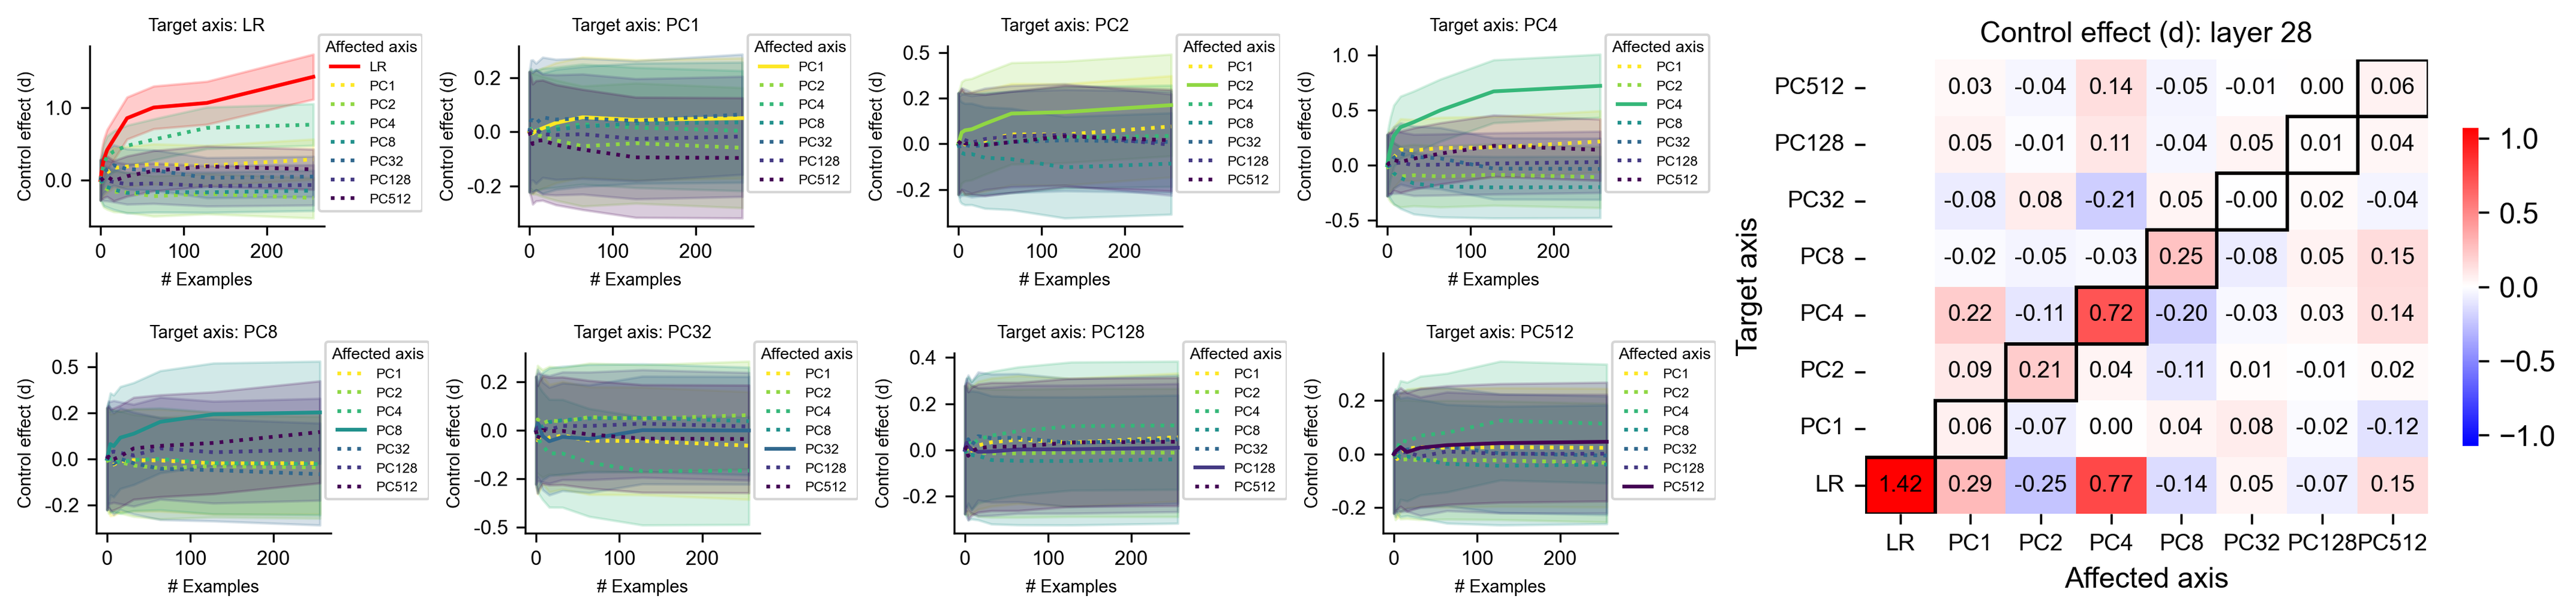
| **LR** | **Strong Upward Slope:** Starts at 0, rises sharply to ~0.8 by 50 examples, and reaches ~1.4 by 250 examples. | PC4 (Teal) shows a moderate positive trend (~0.7). Others remain near 0. |
| **PC1** | **Flat/Low Trend:** The solid yellow line stays very close to 0, ending slightly above 0. | Most affected axes cluster around 0 with high variance. |
| **PC2** | **Slight Upward Slope:** Solid green line rises gradually to ~0.2. | PC4 and PC1 show slight positive trends; others are flat. |
| **PC4** | **Strong Upward Slope:** Solid teal line rises significantly, reaching ~0.7 by 250 examples. | PC1 and PC2 show slight positive trends. |
| **PC8** | **Moderate Upward Slope:** Solid blue-green line rises to ~0.25. | PC512 (Purple) shows a slight upward trend (~0.15). |
| **PC32** | **Flat Trend:** Solid blue line remains near 0 throughout. | All affected axes are tightly clustered around the 0 baseline. |
| **PC128** | **Flat Trend:** Solid dark blue line remains near 0. | Minimal deviation from 0 for all axes. |
| **PC512** | **Flat Trend:** Solid purple line remains near 0. | Minimal deviation from 0 for all axes. |
---
## 3. Component Isolation: Heatmap (Right Section)
### Metadata
- **Title:** Control effect (d): layer 28
- **Y-axis (Target axis):** PC512, PC128, PC32, PC8, PC4, PC2, PC1, LR (Top to Bottom).
- **X-axis (Affected axis):** LR, PC1, PC2, PC4, PC8, PC32, PC128, PC512 (Left to Right).
- **Color Scale:**
- **Red:** Positive effect (up to 1.0+).
- **White:** Zero effect (0.0).
- **Blue:** Negative effect (down to -1.0).
- **Visual Feature:** The diagonal (Self-influence) is highlighted with thick black borders.
### Data Table Reconstruction (Numerical Values)
| Target \ Affected | LR | PC1 | PC2 | PC4 | PC8 | PC32 | PC128 | PC512 |
| :--- | :---: | :---: | :---: | :---: | :---: | :---: | :---: | :---: |
| **PC512** | 0.03 | -0.04 | 0.14 | -0.05 | -0.01 | 0.00 | 0.06 | **0.06** |
| **PC128** | 0.05 | -0.01 | 0.11 | -0.04 | 0.05 | 0.01 | **0.04** | 0.04 |
| **PC32** | -0.08 | 0.08 | -0.21 | 0.05 | -0.00 | **0.02** | -0.04 | -0.04 |
| **PC8** | -0.02 | -0.05 | -0.03 | 0.25 | **-0.08** | 0.05 | 0.15 | 0.15 |
| **PC4** | 0.22 | -0.11 | 0.72 | **-0.20** | -0.03 | 0.03 | 0.14 | 0.14 |
| **PC2** | 0.09 | 0.21 | **0.04** | -0.11 | 0.01 | -0.01 | 0.02 | 0.02 |
| **PC1** | 0.06 | **-0.07** | 0.00 | 0.04 | 0.08 | -0.02 | -0.12 | -0.12 |
| **LR** | **1.42** | 0.29 | -0.25 | 0.77 | -0.14 | 0.05 | -0.07 | 0.15 |
*(Note: The diagonal values represent the self-control effect. The highest value in the entire dataset is the LR-LR interaction at **1.42**.)*
---
## 4. Key Trends and Observations
1. **Dominance of LR:** The Linear Regression (LR) axis shows the most significant control effect (1.42), followed by PC4 (0.72) and PC8 (0.25).
2. **Cross-Axis Influence:** There is a notable cross-influence between the LR target and the PC4 affected axis (0.77), and between the PC4 target and the PC2 affected axis (0.72).
3. **Stability in Higher PCs:** Axes PC32, PC128, and PC512 show very low control effects (near 0), suggesting these components are less susceptible to control interventions at Layer 28.
4. **Negative Correlations:** The strongest negative effect is between Target PC32 and Affected PC2 (-0.21) and Target LR and Affected PC2 (-0.25).