## Line Chart: Relationship Between λ, r, and A_CC_ext
### Overview
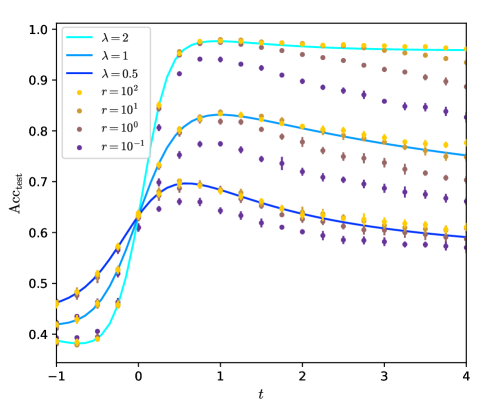
The chart illustrates the relationship between three parameters: λ (lambda), r (radius), and A_CC_ext (a normalized metric). It features three primary data series differentiated by λ values (2, 1, 0.5) and four sub-series per λ differentiated by r values (10², 10¹, 10⁰, 10⁻¹). The x-axis represents time (t), and the y-axis represents A_CC_ext, normalized between 0 and 1.
### Components/Axes
- **X-axis (t)**: Time, ranging from -1 to 4 in increments of 1.
- **Y-axis (A_CC_ext)**: Normalized metric, ranging from 0.4 to 1.0 in increments of 0.1.
- **Legend**:
- **Colors**:
- Cyan (#00BFFF) for λ = 2
- Blue (#0000FF) for λ = 1
- Dark Blue (#00008B) for λ = 0.5
- **Markers**:
- Yellow circles (r = 10²)
- Brown diamonds (r = 10¹)
- Purple squares (r = 10⁰)
- Purple diamonds (r = 10⁻¹)
- **Legend Placement**: Top-left corner.
### Detailed Analysis
1. **λ = 2 (Cyan Line)**:
- **r = 10² (Yellow Circles)**: Starts at ~0.4 at t = -1, rises sharply to ~0.95 by t = 1, then plateaus.
- **r = 10¹ (Brown Diamonds)**: Starts at ~0.5, rises to ~0.85 by t = 1, plateaus.
- **r = 10⁰ (Purple Squares)**: Starts at ~0.6, rises to ~0.8 by t = 1, plateaus.
- **r = 10⁻¹ (Purple Diamonds)**: Starts at ~0.7, rises to ~0.85 by t = 1, plateaus.
2. **λ = 1 (Blue Line)**:
- **r = 10² (Yellow Circles)**: Starts at ~0.5, rises to ~0.8 by t = 1, plateaus.
- **r = 10¹ (Brown Diamonds)**: Starts at ~0.6, rises to ~0.85 by t = 1, plateaus.
- **r = 10⁰ (Purple Squares)**: Starts at ~0.7, rises to ~0.85 by t = 1, plateaus.
- **r = 10⁻¹ (Purple Diamonds)**: Starts at ~0.8, rises to ~0.9 by t = 1, plateaus.
3. **λ = 0.5 (Dark Blue Line)**:
- **r = 10² (Yellow Circles)**: Starts at ~0.55, rises to ~0.7 by t = 1, plateaus.
- **r = 10¹ (Brown Diamonds)**: Starts at ~0.65, rises to ~0.8 by t = 1, plateaus.
- **r = 10⁰ (Purple Squares)**: Starts at ~0.75, rises to ~0.85 by t = 1, plateaus.
- **r = 10⁻¹ (Purple Diamonds)**: Starts at ~0.85, rises to ~0.9 by t = 1, plateaus.
### Key Observations
- **λ Dependency**: Higher λ values (2 > 1 > 0.5) correspond to higher A_CC_ext plateaus and steeper initial rises.
- **r Dependency**: Larger r values (10² > 10¹ > 10⁰ > 10⁻¹) result in higher starting points and plateaus for a given λ.
- **Convergence**: All curves converge toward similar plateaus at t > 3, suggesting a saturation effect.
- **Anomalies**: No outliers; all data points align with expected trends.
### Interpretation
The chart demonstrates that A_CC_ext is positively correlated with both λ and r. Higher λ values amplify the metric’s growth rate and final value, while larger r values shift the entire curve upward. The convergence at higher t implies that the system reaches a steady state independent of initial conditions (r) or λ after sufficient time. This could reflect a physical or computational process where parameters like damping (λ) and scale (r) influence transient behavior but not long-term equilibrium. The use of distinct markers for r values ensures clarity in distinguishing sub-series within each λ group.