## Pie Charts: Error Distribution in Search Engines (Search Only w/ Demo)
### Overview
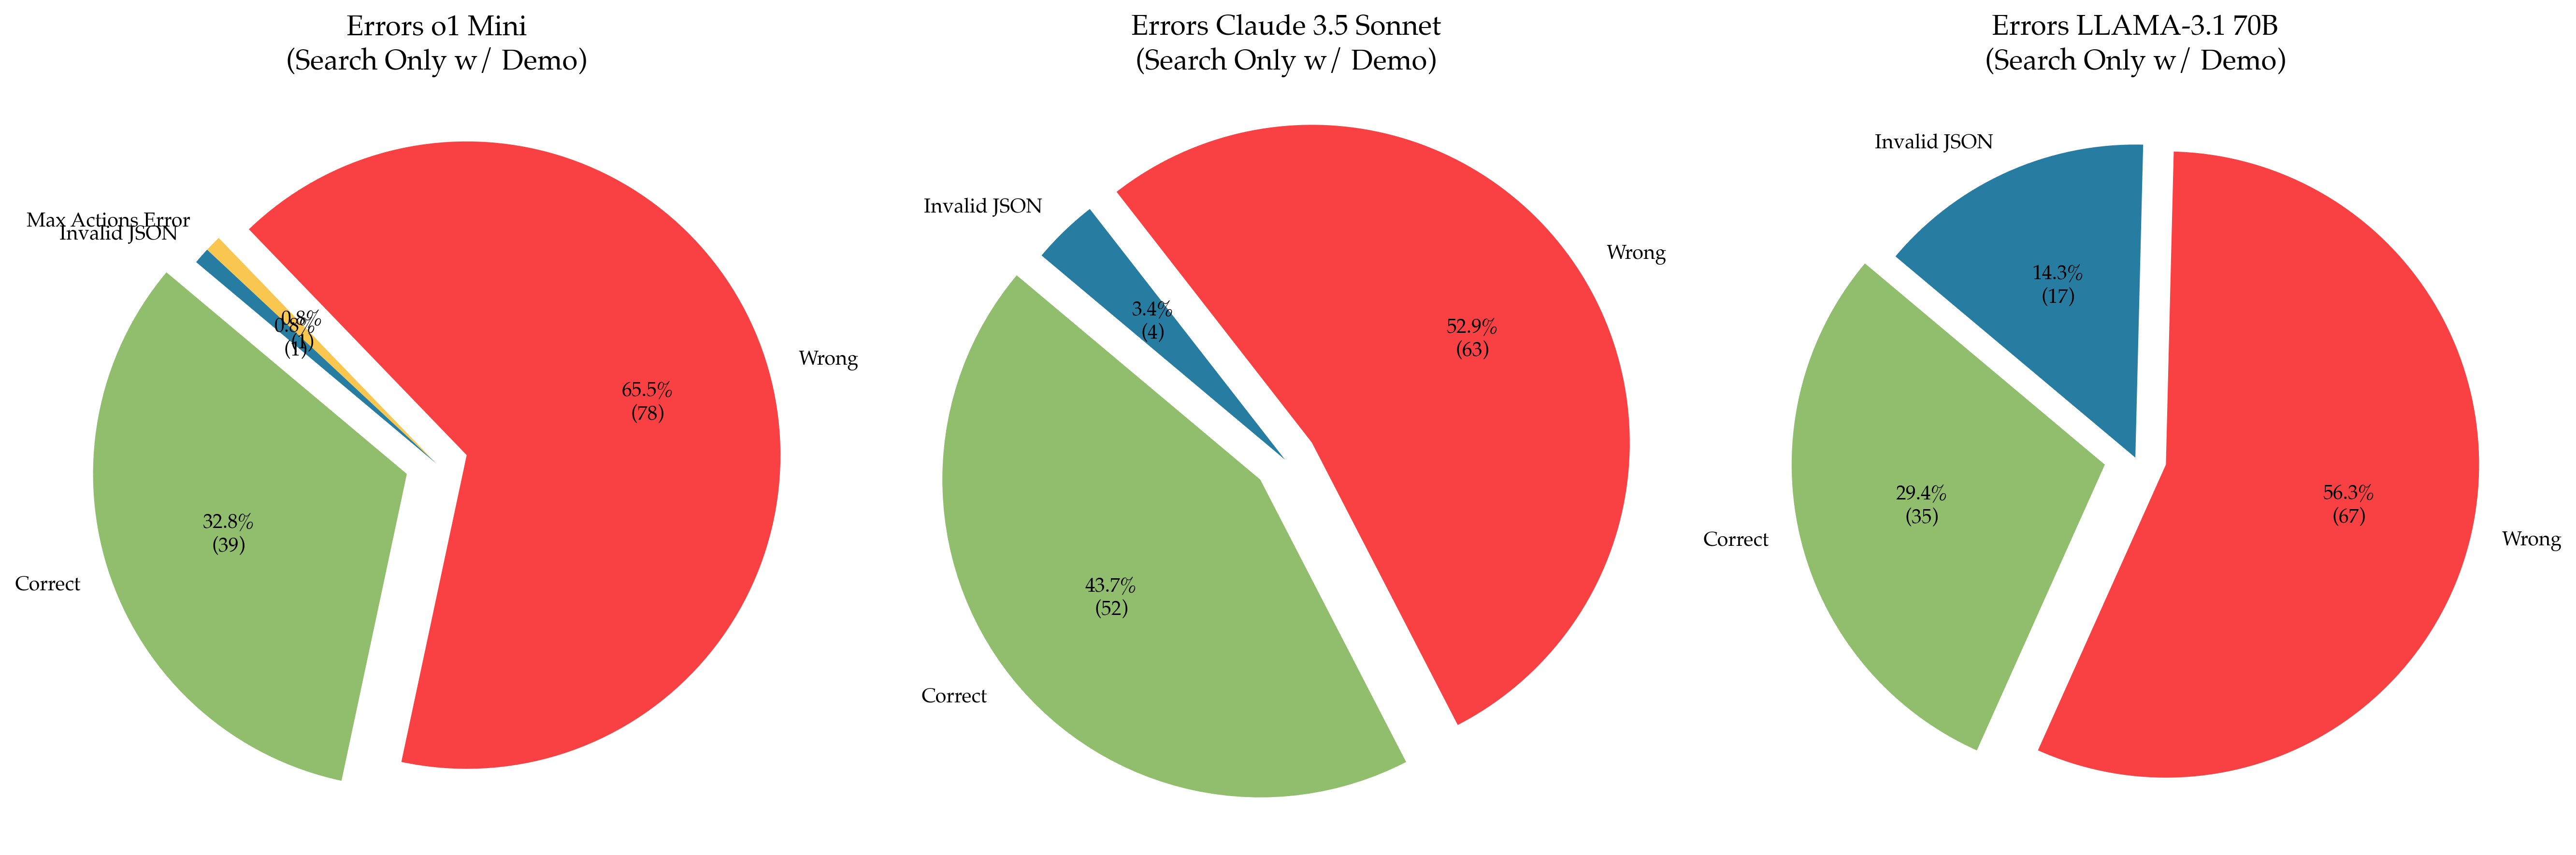
Three pie charts compare error distributions across three AI search engines:
1. **Errors o1 Mini**
2. **Errors Claude 3.5 Sonnet**
3. **Errors LLaMA-3.1 70B**
Each chart categorizes results into **Correct**, **Wrong**, **Invalid JSON**, and (for o1 Mini only) **Max Actions Error**.
---
### Components/Axes
- **Legend**:
- **Red**: Wrong answers
- **Green**: Correct answers
- **Blue**: Invalid JSON
- **Yellow**: Max Actions Error (only in o1 Mini)
- **Axes**:
- No explicit axes; segments represent proportions of total errors.
- Percentages and raw counts (in parentheses) are embedded in segments.
---
### Detailed Analysis
#### 1. **Errors o1 Mini**
- **Wrong**: 65.5% (78) — Dominates the chart in red.
- **Correct**: 32.8% (39) — Green segment.
- **Invalid JSON**: 0.8% (1) — Tiny blue slice.
- **Max Actions Error**: 0.8% (1) — Yellow sliver.
#### 2. **Errors Claude 3.5 Sonnet**
- **Wrong**: 52.9% (63) — Largest segment (red).
- **Correct**: 43.7% (52) — Green segment.
- **Invalid JSON**: 3.4% (4) — Small blue slice.
#### 3. **Errors LLaMA-3.1 70B**
- **Wrong**: 56.3% (67) — Largest segment (red).
- **Correct**: 29.4% (35) — Green segment.
- **Invalid JSON**: 14.3% (17) — Largest blue segment.
---
### Key Observations
1. **o1 Mini** has the highest proportion of **Wrong** answers (65.5%) and the lowest **Invalid JSON** rate (0.8%).
2. **Claude 3.5 Sonnet** balances **Wrong** (52.9%) and **Correct** (43.7%) answers, with moderate **Invalid JSON** (3.4%).
3. **LLaMA-3.1 70B** has the highest **Invalid JSON** rate (14.3%) and the lowest **Correct** answers (29.4%).
4. **Max Actions Error** appears only in o1 Mini, suggesting stricter action limits or unique failure modes.
---
### Interpretation
- **Error Prioritization**:
- o1 Mini prioritizes reducing **Invalid JSON** but struggles with **Wrong** answers.
- Claude 3.5 Sonnet shows a more balanced error profile, with fewer **Invalid JSON** issues than LLaMA.
- LLaMA-3.1 70B has the highest **Invalid JSON** rate, indicating potential issues with response formatting or schema adherence.
- **Performance Implications**:
- High **Wrong** rates across all models suggest challenges in accuracy or reasoning.
- **Invalid JSON** spikes in LLaMA-3.1 70B may reflect instability in structured output generation.
- **Anomalies**:
- o1 Mini’s **Max Actions Error** is unique, possibly tied to API rate-limiting or resource constraints.
These charts highlight trade-offs between accuracy, validity, and robustness across models, with LLaMA-3.1 70B showing the most instability in structured outputs.