## Scatter Plot: Reasoning Tokens vs. Problem Size for deepseek/deepseek-r1
### Overview
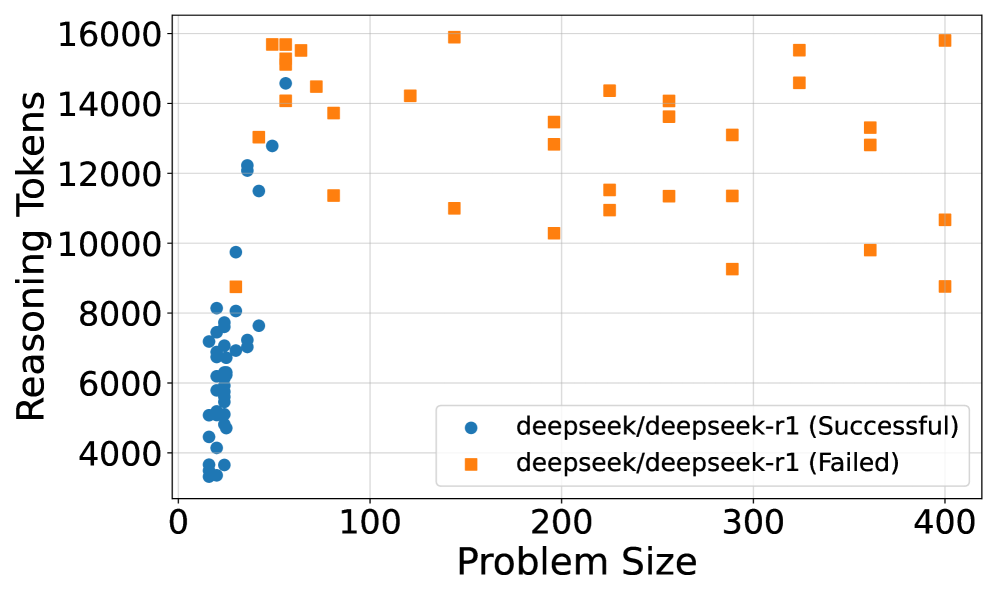
The image is a scatter plot showing the relationship between "Reasoning Tokens" and "Problem Size" for the deepseek/deepseek-r1 model. The plot distinguishes between successful and failed attempts using different colored markers: blue circles for successful attempts and orange squares for failed attempts. The plot shows that successful attempts tend to cluster at smaller problem sizes, while failed attempts are scattered across a wider range of problem sizes and token counts.
### Components/Axes
* **X-axis:** Problem Size, ranging from 0 to 400. Axis markers are present at 0, 100, 200, 300, and 400.
* **Y-axis:** Reasoning Tokens, ranging from 4000 to 16000. Axis markers are present at 4000, 6000, 8000, 10000, 12000, 14000, and 16000.
* **Legend:** Located in the bottom-right corner of the plot.
* Blue circles: deepseek/deepseek-r1 (Successful)
* Orange squares: deepseek/deepseek-r1 (Failed)
### Detailed Analysis
* **deepseek/deepseek-r1 (Successful):**
* The blue circles, representing successful attempts, are concentrated at smaller problem sizes (0-100).
* The number of reasoning tokens for successful attempts generally ranges from approximately 3500 to 14500.
* The trend for successful attempts shows a slight increase in reasoning tokens as the problem size increases within the 0-100 range.
* Specific data points:
* Problem Size ~10, Reasoning Tokens ~3500
* Problem Size ~20, Reasoning Tokens ~5000
* Problem Size ~30, Reasoning Tokens ~7000
* Problem Size ~40, Reasoning Tokens ~7500
* Problem Size ~50, Reasoning Tokens ~7500
* Problem Size ~60, Reasoning Tokens ~8000
* Problem Size ~70, Reasoning Tokens ~12000
* Problem Size ~80, Reasoning Tokens ~14500
* **deepseek/deepseek-r1 (Failed):**
* The orange squares, representing failed attempts, are scattered across a wider range of problem sizes (approximately 50 to 400).
* The number of reasoning tokens for failed attempts ranges from approximately 8500 to 16000.
* There is no clear trend between problem size and reasoning tokens for failed attempts.
* Specific data points:
* Problem Size ~50, Reasoning Tokens ~15500
* Problem Size ~75, Reasoning Tokens ~14000
* Problem Size ~100, Reasoning Tokens ~11500
* Problem Size ~150, Reasoning Tokens ~14000
* Problem Size ~175, Reasoning Tokens ~11000
* Problem Size ~200, Reasoning Tokens ~13500
* Problem Size ~225, Reasoning Tokens ~11500
* Problem Size ~250, Reasoning Tokens ~14000
* Problem Size ~275, Reasoning Tokens ~9000
* Problem Size ~300, Reasoning Tokens ~11500
* Problem Size ~325, Reasoning Tokens ~14000
* Problem Size ~350, Reasoning Tokens ~13000
* Problem Size ~375, Reasoning Tokens ~10000
* Problem Size ~400, Reasoning Tokens ~9000
### Key Observations
* Successful attempts are clustered at smaller problem sizes, suggesting that the model is more likely to succeed with simpler problems.
* Failed attempts are scattered across a wider range of problem sizes, indicating that larger problem sizes do not guarantee failure, but the model's performance becomes less predictable.
* The number of reasoning tokens used in failed attempts is generally higher than in successful attempts, suggesting that the model may be using more resources when it fails.
### Interpretation
The data suggests that the deepseek/deepseek-r1 model is more effective at solving smaller problems. As the problem size increases, the model's success rate decreases, and the number of reasoning tokens used in failed attempts tends to be higher. This could indicate that the model struggles to efficiently process larger, more complex problems, leading to increased resource consumption and eventual failure. The scattering of failed attempts across a wide range of problem sizes and token counts suggests that other factors, besides problem size and token usage, may also contribute to the model's failure. Further investigation is needed to identify these factors and improve the model's performance on larger problems.