\n
## Scatter Plot: Reasoning Tokens vs. Problem Size for DeepSeek-R1
### Overview
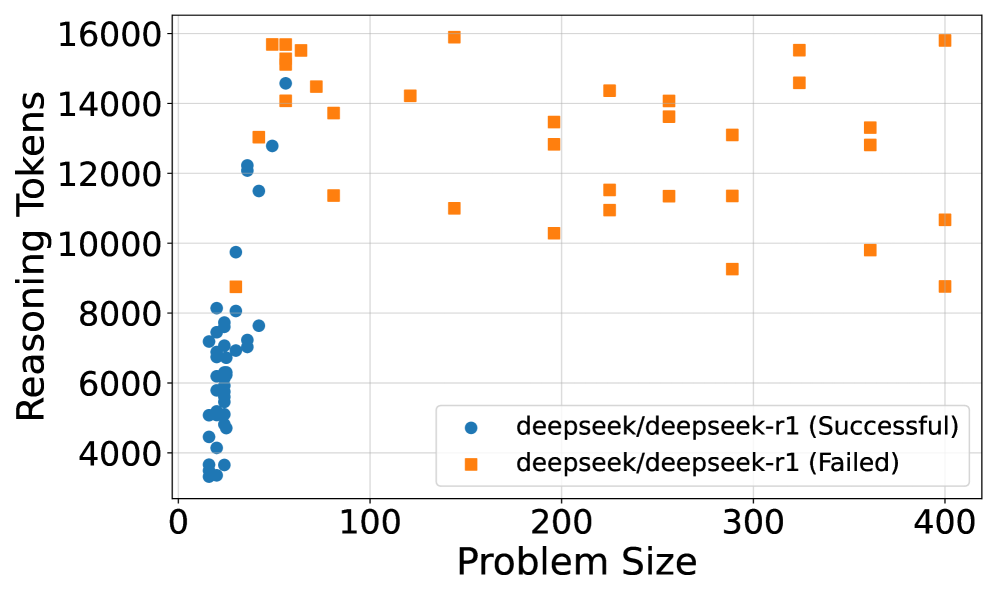
This image is a scatter plot comparing the number of "Reasoning Tokens" used against "Problem Size" for a model identified as "deepseek/deepseek-r1". The data is split into two series: successful attempts and failed attempts. The plot reveals a distinct separation in the distribution of these two outcomes based on problem size.
### Components/Axes
* **Chart Type:** Scatter Plot.
* **X-Axis:** Labeled "Problem Size". The scale runs from 0 to 400, with major tick marks at 0, 100, 200, 300, and 400.
* **Y-Axis:** Labeled "Reasoning Tokens". The scale runs from 0 to 16000, with major tick marks at 0, 2000, 4000, 6000, 8000, 10000, 12000, 14000, and 16000.
* **Legend:** Located in the bottom-right quadrant of the chart area.
* Blue Circle (●): `deepseek/deepseek-r1 (Successful)`
* Orange Square (■): `deepseek/deepseek-r1 (Failed)`
### Detailed Analysis
**1. Data Series: Successful Attempts (Blue Circles)**
* **Spatial Grounding & Trend:** This series is densely clustered in the far-left region of the chart, corresponding to low "Problem Size" values. The trend shows a steep, near-vertical increase in reasoning tokens as problem size increases from approximately 10 to 50.
* **Data Points (Approximate):**
* Problem Size Range: ~10 to ~50.
* Reasoning Tokens Range: ~3,000 to ~15,000.
* The highest token count for a successful run is approximately 14,500 at a problem size of ~50.
* The lowest token count is approximately 3,000 at a problem size of ~15.
* The majority of points are concentrated between problem sizes 20-40 and token counts 4,000-8,000.
**2. Data Series: Failed Attempts (Orange Squares)**
* **Spatial Grounding & Trend:** This series is widely dispersed across the entire x-axis. There is no single linear trend; instead, the points form a broad, scattered cloud. However, the minimum token count for failures appears to increase slightly with problem size.
* **Data Points (Approximate):**
* Problem Size Range: ~50 to 400.
* Reasoning Tokens Range: ~8,500 to ~16,000.
* Notable points include:
* A cluster of high-token failures (14,000-16,000) at low problem sizes (~50-80).
* A point at problem size ~140 with ~11,000 tokens.
* A point at problem size ~200 with ~10,200 tokens.
* The highest token count is near 16,000 at problem sizes ~140 and ~400.
* The lowest token count is approximately 8,500 at a problem size of ~400.
### Key Observations
1. **Clear Segmentation by Outcome:** There is a stark, almost complete separation between successful and failed attempts along the "Problem Size" axis. All successful attempts occur at problem sizes below ~50, while all failed attempts occur at problem sizes above ~50.
2. **Token Usage Patterns:** Successful attempts show a strong, positive correlation between problem size and token usage within their limited range. Failed attempts show high variability in token usage across all problem sizes, with no strong correlation.
3. **Overlap in Token Counts:** The token count ranges for success (~3k-15k) and failure (~8.5k-16k) overlap significantly, particularly in the 8,500-15,000 range. This indicates that high token usage alone does not predict failure; problem size is the critical dividing factor.
4. **Absence of Data:** There are no data points for successful attempts beyond a problem size of ~50, and no data points for failed attempts below a problem size of ~50.
### Interpretation
The data suggests a critical threshold in "Problem Size" around the value of 50 for the `deepseek/deepseek-r1` model under the tested conditions.
* **Performance Boundary:** The model appears capable of solving problems only up to a certain size (~50). Beyond this threshold, it consistently fails, regardless of the computational effort (reasoning tokens) expended.
* **Efficiency vs. Scale:** For small problems (size <50), the model's reasoning effort scales with problem complexity. For large problems (size >50), the model engages in extensive reasoning (often using 10,000+ tokens) but cannot achieve success, indicating a fundamental limitation in its reasoning capacity or approach for larger-scale tasks.
* **Investigative Insight:** The plot does not show *why* failures occur at large sizes. It could be due to context window limitations, error propagation in long reasoning chains, or a flaw in the model's problem-decomposition strategy for complex tasks. The high token usage in failures suggests the model is attempting to reason but is unable to converge on a correct solution. This visualization clearly identifies "Problem Size > 50" as a key area for debugging and improvement.