TECHNICAL ASSET FINGERPRINT
e21318051dcc93e4498d70f1
Click to view fullscreen
Press ESC or click to close
FOUND IN PAPERS
EXPERT: healer-alpha-free VERSION 1
RUNTIME: free/openrouter/healer-alpha
INTEL_VERIFIED
## Line Charts: Comparative Accuracy of "ReST" vs. "Ours" Across Multiple Benchmarks
### Overview
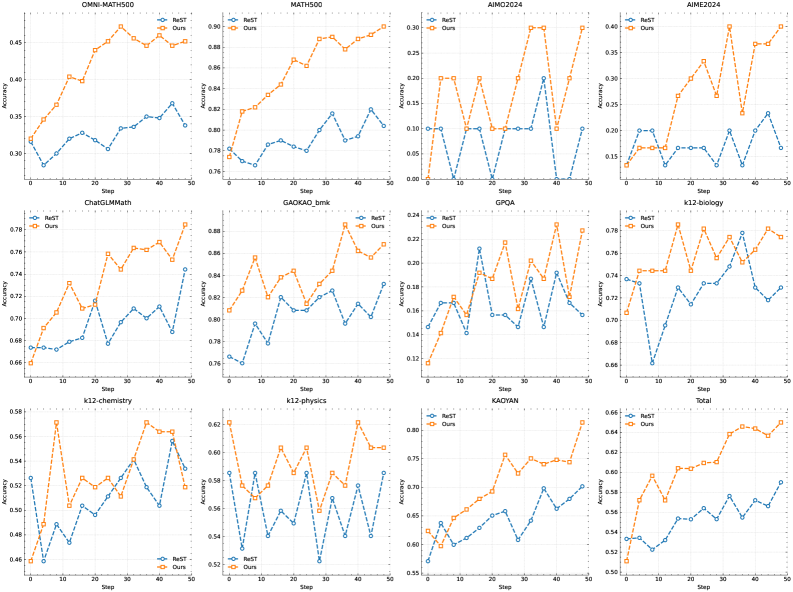
The image displays a grid of 12 line charts arranged in 3 rows and 4 columns. Each chart compares the performance of two methods, labeled "ReST" (blue line with circle markers) and "Ours" (orange line with circle markers), across a series of training or evaluation steps. The charts track "Accuracy" on the y-axis against "Step" on the x-axis. The overall visual impression is that the "Ours" method generally achieves higher accuracy and shows a more consistent upward trend compared to the more volatile "ReST" method.
### Components/Axes
* **Chart Titles (Benchmarks):** Each subplot is titled with a specific benchmark or dataset name. Reading left-to-right, top-to-bottom, they are:
1. OMNI-MATH500
2. MATH500
3. AIM02024
4. AIME2024
5. ChatGLMMath
6. GAOKAO_bmk
7. GPOA
8. k12-biology
9. k12-chemistry
10. k12-physics
11. KADIAN
12. Total
* **Axes:**
* **X-axis (All Charts):** Labeled "Step". The scale runs from 0 to 50, with major tick marks at intervals of 10 (0, 10, 20, 30, 40, 50).
* **Y-axis (All Charts):** Labeled "Accuracy". The scale and range vary significantly per chart to fit the data.
* **Legend:** Located in the top-left corner of each subplot. It contains two entries:
* A blue line with a circle marker labeled "ReST".
* An orange line with a circle marker labeled "Ours".
* **Data Series:** Each chart contains two line series corresponding to the legend.
### Detailed Analysis
**Chart-by-Chart Data Point Approximation (Trend First, Then Key Points):**
1. **OMNI-MATH500:**
* *Trend:* "Ours" shows a strong, steady upward trend. "ReST" is more volatile with a slight upward drift.
* *Data:* "Ours" starts at ~0.32 (Step 0), rises to a peak of ~0.46 (Step ~35), and ends at ~0.45 (Step 50). "ReST" starts at ~0.30, dips to ~0.28 (Step 5), fluctuates, and ends at ~0.37.
2. **MATH500:**
* *Trend:* "Ours" has a clear, strong upward trend. "ReST" is volatile with a moderate upward trend.
* *Data:* "Ours" starts at ~0.78, climbs steadily to ~0.89 (Step 50). "ReST" starts at ~0.78, dips to ~0.76 (Step 10), and ends at ~0.81.
3. **AIM02024:**
* *Trend:* Both series are highly volatile. "Ours" shows a general upward trend despite large swings. "ReST" is erratic with no clear trend.
* *Data:* "Ours" starts at ~0.05, peaks at ~0.30 (Steps 30 & 45), ends at ~0.30. "ReST" starts at ~0.10, fluctuates wildly between ~0.05 and ~0.20, ends at ~0.10.
4. **AIME2024:**
* *Trend:* "Ours" shows a strong upward trend. "ReST" is volatile with a slight upward trend.
* *Data:* "Ours" starts at ~0.10, rises to ~0.40 (Step 40), ends at ~0.38. "ReST" starts at ~0.10, fluctuates between ~0.15 and ~0.23, ends at ~0.17.
5. **ChatGLMMath:**
* *Trend:* "Ours" shows a steady upward trend. "ReST" is volatile with a slight upward trend.
* *Data:* "Ours" starts at ~0.68, rises to ~0.78 (Step 50). "ReST" starts at ~0.68, fluctuates between ~0.66 and ~0.71, ends at ~0.74.
6. **GAOKAO_bmk:**
* *Trend:* "Ours" shows a strong upward trend. "ReST" is volatile with a moderate upward trend.
* *Data:* "Ours" starts at ~0.80, rises to ~0.88 (Step 40), ends at ~0.86. "ReST" starts at ~0.77, fluctuates between ~0.78 and ~0.83, ends at ~0.83.
7. **GPOA:**
* *Trend:* Both series are highly volatile and intertwined. No clear, consistent leader.
* *Data:* Both start near ~0.14. They fluctuate sharply between ~0.14 and ~0.22. At Step 50, "Ours" is at ~0.22 and "ReST" is at ~0.16.
8. **k12-biology:**
* *Trend:* "Ours" shows a moderate upward trend. "ReST" is volatile with a slight upward trend.
* *Data:* "Ours" starts at ~0.70, rises to ~0.78 (Step 45), ends at ~0.77. "ReST" starts at ~0.73, dips to ~0.66 (Step 10), fluctuates, ends at ~0.73.
9. **k12-chemistry:**
* *Trend:* "Ours" is volatile but shows a general upward trend. "ReST" is also volatile with a slight upward trend.
* *Data:* "Ours" starts at ~0.50, peaks at ~0.58 (Step 10 & 35), ends at ~0.56. "ReST" starts at ~0.54, dips to ~0.46 (Step 5), fluctuates, ends at ~0.54.
10. **k12-physics:**
* *Trend:* "Ours" shows a moderate upward trend. "ReST" is volatile with no clear trend.
* *Data:* "Ours" starts at ~0.58, rises to ~0.62 (Step 40), ends at ~0.60. "ReST" starts at ~0.57, fluctuates between ~0.52 and ~0.58, ends at ~0.55.
11. **KADIAN:**
* *Trend:* "Ours" shows a strong, steady upward trend. "ReST" shows a moderate upward trend.
* *Data:* "Ours" starts at ~0.60, rises to ~0.80 (Step 50). "ReST" starts at ~0.62, rises to ~0.70 (Step 50).
12. **Total:**
* *Trend:* "Ours" shows a very strong, consistent upward trend. "ReST" shows a moderate, volatile upward trend.
* *Data:* "Ours" starts at ~0.52, rises steadily to ~0.65 (Step 50). "ReST" starts at ~0.52, fluctuates between ~0.53 and ~0.58, ends at ~0.58.
### Key Observations
1. **Consistent Superiority:** In 11 out of 12 charts, the "Ours" method ends at a higher accuracy than "ReST". The only exception is GPOA, where they are close.
2. **Trend Stability:** The "Ours" line typically exhibits a smoother, more consistent upward trajectory. The "ReST" line is characterized by high volatility and frequent, sharp fluctuations.
3. **Benchmark Variability:** Performance gaps vary by benchmark. The gap is very large in OMNI-MATH500, AIME2024, and the "Total" chart. It is smallest in GPOA and k12-chemistry.
4. **Starting Points:** In most charts, both methods begin at a similar accuracy level at Step 0, making the subsequent divergence more notable.
5. **Peak Performance:** "Ours" often reaches its peak accuracy in the later steps (30-50), while "ReST" peaks are more scattered and often not sustained.
### Interpretation
This collection of charts presents a compelling case for the effectiveness of the proposed method ("Ours") compared to the baseline ("ReST") across a diverse set of mathematical and scientific reasoning benchmarks.
* **What the Data Suggests:** The data demonstrates that "Ours" not only achieves higher final accuracy but also learns more reliably and stably over time. The high volatility of "ReST" suggests its training or evaluation process is less robust, potentially sensitive to specific data batches or steps.
* **Relationship Between Elements:** The "Total" chart aggregates the performance, confirming the overall trend seen in individual benchmarks. The consistency across different domains (general math, competition math, K12 subjects) indicates the improvement is not niche but broadly applicable.
* **Notable Anomalies:** The GPOA chart is the primary outlier, where neither method shows a clear advantage and both are highly unstable. This suggests the GPOA benchmark may be particularly challenging or noisy, or that the methods behave differently on this specific task type.
* **Underlying Implication:** The results imply that the architectural or training innovations in "Ours" lead to more effective and stable optimization for complex reasoning tasks. The steady climb of "Ours" suggests it continues to benefit from extended training (more steps), whereas "ReST" may plateau or become unstable. This has practical significance for resource allocation in model training.
DECODING INTELLIGENCE...