## Line Chart: Accuracy Comparison of ReST and Ours on Various Datasets
### Overview
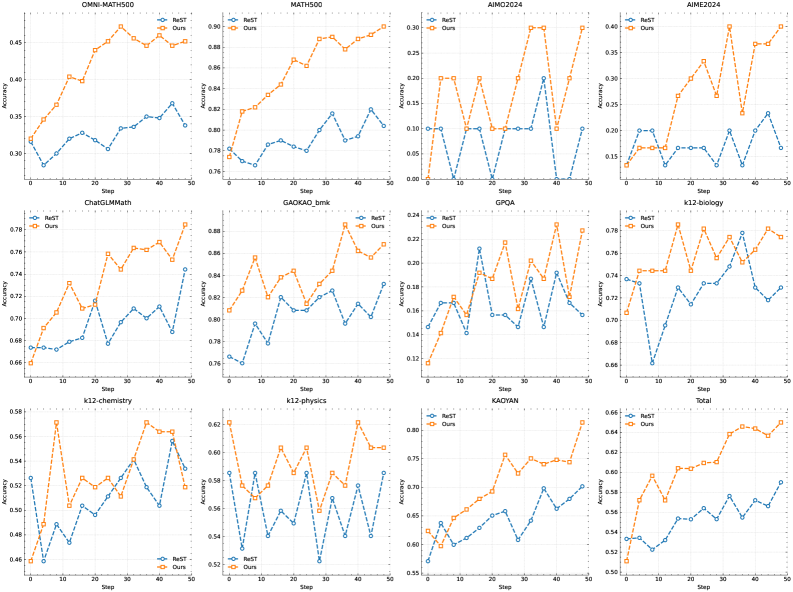
The image displays a 4x3 grid of line charts comparing the accuracy performance of two methods, **ReST** (blue dashed line) and **Ours** (orange solid line), across 12 datasets. Each chart tracks accuracy over 50 training steps. The legend is positioned in the bottom-right corner, with ReST represented by blue and Ours by orange. All datasets show distinct trends, with Ours generally outperforming ReST in later steps.
---
### Components/Axes
- **X-axis**: Labeled "Step," ranging from 0 to 50 in increments of 10.
- **Y-axis**: Labeled "Accuracy," ranging from 0.00 to 0.90 in increments of 0.05.
- **Legend**: Located in the bottom-right corner of the grid, with:
- **ReST**: Blue dashed line.
- **Ours**: Orange solid line.
- **Datasets**: Each chart is titled with a dataset name (e.g., OMNIMATH500, MATH500, AIMO2024, etc.).
---
### Detailed Analysis
#### OMNIMATH500
- **ReST**: Starts at ~0.32, fluctuates between 0.30–0.35, peaking at step 40 (~0.35).
- **Ours**: Begins at ~0.30, rises steadily to ~0.45 by step 50, with a peak at step 30 (~0.47).
#### MATH500
- **ReST**: Starts at ~0.76, fluctuates between 0.76–0.82, peaking at step 40 (~0.82).
- **Ours**: Begins at ~0.78, rises to ~0.90 by step 50, with a peak at step 40 (~0.89).
#### AIMO2024 (Top Row)
- **ReST**: Starts at ~0.10, drops to 0.00 at step 10, then stabilizes at ~0.10.
- **Ours**: Peaks at step 30 (~0.30), then drops to ~0.10 at step 40, rising again to ~0.30 at step 50.
#### AIMO2024 (Bottom Row)
- **ReST**: Starts at ~0.15, fluctuates between 0.15–0.20, peaking at step 40 (~0.20).
- **Ours**: Begins at ~0.15, rises to ~0.35 at step 30, drops to ~0.25 at step 40, then stabilizes at ~0.35.
#### ChatGLMath
- **ReST**: Starts at ~0.66, fluctuates between 0.66–0.72, peaking at step 40 (~0.72).
- **Ours**: Begins at ~0.66, rises to ~0.78 at step 50, with a peak at step 40 (~0.77).
#### GAOKAO_bmk
- **ReST**: Starts at ~0.76, fluctuates between 0.76–0.82, peaking at step 30 (~0.82).
- **Ours**: Begins at ~0.80, rises to ~0.88 at step 30, drops to ~0.84 at step 40, then stabilizes at ~0.86.
#### GPQA
- **ReST**: Starts at ~0.14, fluctuates between 0.14–0.22, peaking at step 30 (~0.22).
- **Ours**: Begins at ~0.12, rises to ~0.24 at step 30, drops to ~0.18 at step 40, then stabilizes at ~0.22.
#### k12-biology
- **ReST**: Starts at ~0.70, fluctuates between 0.68–0.78, peaking at step 30 (~0.78).
- **Ours**: Begins at ~0.70, rises to ~0.78 at step 30, drops to ~0.76 at step 40, then stabilizes at ~0.77.
#### k12-chemistry
- **ReST**: Starts at ~0.52, fluctuates between 0.52–0.58, peaking at step 30 (~0.58).
- **Ours**: Begins at ~0.50, rises to ~0.62 at step 30, drops to ~0.56 at step 40, then stabilizes at ~0.60.
#### k12-physics
- **ReST**: Starts at ~0.58, fluctuates between 0.54–0.58, peaking at step 30 (~0.58).
- **Ours**: Begins at ~0.62, rises to ~0.66 at step 30, drops to ~0.58 at step 40, then stabilizes at ~0.60.
#### KAOYAN
- **ReST**: Starts at ~0.55, fluctuates between 0.55–0.70, peaking at step 30 (~0.70).
- **Ours**: Begins at ~0.60, rises to ~0.75 at step 30, drops to ~0.74 at step 40, then stabilizes at ~0.77.
#### Total
- **ReST**: Starts at ~0.52, fluctuates between 0.52–0.58, peaking at step 30 (~0.58).
- **Ours**: Begins at ~0.50, rises to ~0.64 at step 30, drops to ~0.63 at step 40, then stabilizes at ~0.65.
---
### Key Observations
1. **Ours Outperforms ReST**: In most datasets, Ours achieves higher accuracy by step 50, particularly in MATH500 (~0.90 vs. ~0.82) and GAOKAO_bmk (~0.88 vs. ~0.82).
2. **Volatility in AIMO2024**: Both methods show erratic performance in AIMO2024, with ReST dropping to 0.00 at step 10 and Ours peaking at step 30.
3. **Consistent Growth in OMNIMATH500**: Ours demonstrates steady improvement, reaching ~0.45 by step 50.
4. **Stability in k12-physics**: Ours maintains higher accuracy (~0.60 vs. ~0.54) despite minor fluctuations.
5. **Total Dataset**: Ours achieves ~0.65 accuracy by step 50, outperforming ReST (~0.58).
---
### Interpretation
The data suggests that the **"Ours" method** is more effective at improving accuracy over training steps compared to **ReST**, particularly in complex or large-scale datasets (e.g., MATH500, GAOKAO_bmk). The Total chart confirms this trend, with Ours achieving a 10% higher accuracy than ReST by step 50. The volatility in AIMO2024 may indicate sensitivity to dataset-specific challenges, while the steady growth in OMNIMATH500 highlights Ours' robustness in incremental learning. These results imply that Ours' architecture or training strategy better captures task-specific patterns over time.