## Bar Chart: Overall Accuracy Comparison of Methods
### Overview
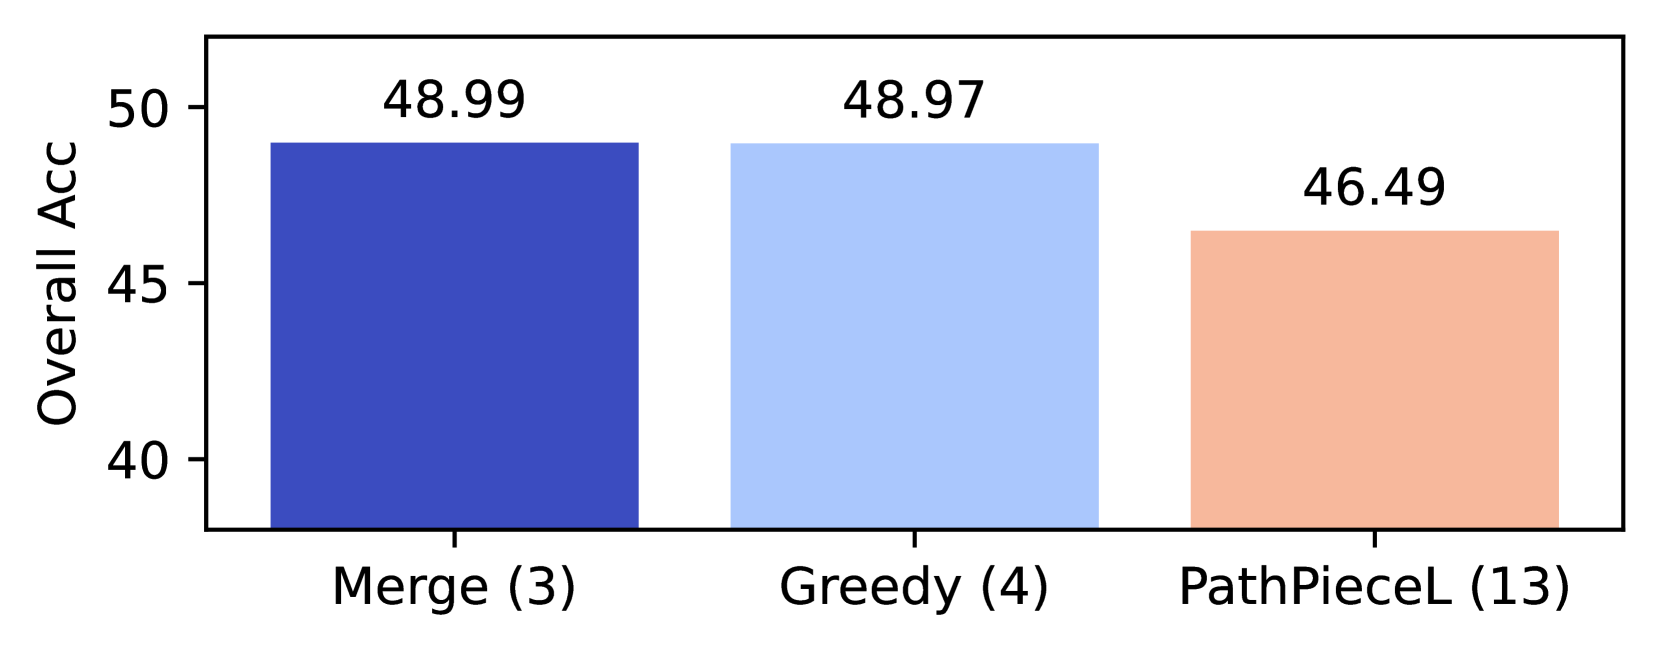
The chart compares the overall accuracy (Overall Acc) of three methods: Merge (3), Greedy (4), and PathPieceL (13). The y-axis represents accuracy as a percentage, ranging from 40 to 50. Each method is represented by a colored bar with its corresponding numerical value displayed above it.
### Components/Axes
- **X-axis**: Method categories labeled as "Merge (3)", "Greedy (4)", and "PathPieceL (13)".
- **Y-axis**: "Overall Acc" (accuracy percentage), scaled from 40 to 50 in increments of 5.
- **Legend**: Located to the right of the bars, associating colors with methods:
- Dark blue: Merge (3)
- Light blue: Greedy (4)
- Peach: PathPieceL (13)
### Detailed Analysis
- **Merge (3)**: Dark blue bar with a value of **48.99** (highest accuracy).
- **Greedy (4)**: Light blue bar with a value of **48.97** (slightly lower than Merge).
- **PathPieceL (13)**: Peach bar with a value of **46.49** (lowest accuracy).
### Key Observations
1. **Merge and Greedy** achieve nearly identical accuracy (~48.98 average), differing by only **0.02%**.
2. **PathPieceL** underperforms significantly, with an accuracy **2.5%** lower than the top two methods.
3. The numerical values are precise, with no visible uncertainty or error bars.
### Interpretation
The data suggests that **Merge and Greedy** are highly effective, with minimal performance difference despite differing component counts (3 vs. 4). **PathPieceL**, while using more components (13), shows notably lower accuracy, implying that increased complexity does not always correlate with improved performance. The tight clustering of Merge and Greedy highlights their robustness, while PathPieceL’s drop may indicate overfitting or inefficiency in its design. This could guide further optimization efforts toward simplifying or refining PathPieceL’s approach.