## Line Graph: Test Accuracy (Acc_test) vs. Time (t)
### Overview
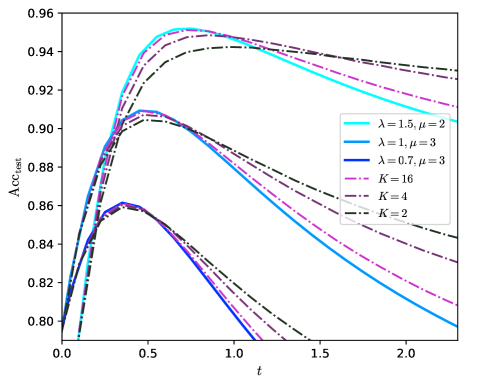
The graph depicts the evolution of test accuracy (Acc_test) over time (t) for multiple parameter configurations. Six distinct data series are plotted, differentiated by line styles and colors. All lines exhibit a bell-shaped curve with a peak followed by a decline, suggesting a trade-off between parameter settings and model performance over time.
### Components/Axes
- **X-axis (t)**: Time, ranging from 0.0 to 2.0 in increments of 0.5.
- **Y-axis (Acc_test)**: Test accuracy, ranging from 0.80 to 0.96 in increments of 0.02.
- **Legend**: Located in the top-right corner, mapping line styles/colors to parameter configurations:
- **Solid lines**:
- Cyan: λ=1.5, μ=2
- Blue: λ=1, μ=3
- Purple: λ=0.7, μ=3
- **Dashed lines**:
- Magenta: K=16
- Dark purple: K=4
- Black: K=2
### Detailed Analysis
1. **λ=1.5, μ=2 (Cyan, solid)**:
- Peaks at ~0.94 at t=0.5.
- Declines sharply after t=0.5, reaching ~0.86 by t=2.0.
2. **λ=1, μ=3 (Blue, solid)**:
- Peaks at ~0.92 at t=0.5.
- Declines gradually, ending at ~0.84 by t=2.0.
3. **λ=0.7, μ=3 (Purple, solid)**:
- Peaks at ~0.90 at t=0.5.
- Declines steeply, dropping to ~0.82 by t=2.0.
4. **K=16 (Magenta, dashed)**:
- Peaks at ~0.93 at t=1.0.
- Declines slowly, ending at ~0.88 by t=2.0.
5. **K=4 (Dark purple, dashed)**:
- Peaks at ~0.91 at t=1.0.
- Declines moderately, ending at ~0.86 by t=2.0.
6. **K=2 (Black, dashed)**:
- Peaks at ~0.89 at t=1.0.
- Declines sharply, ending at ~0.84 by t=2.0.
### Key Observations
- **Parameter Sensitivity**: Higher λ and μ values (e.g., λ=1.5, μ=2) yield higher initial peaks but faster declines.
- **K Value Impact**: Larger K values (e.g., K=16) produce later peaks and slower declines, suggesting a relationship between model complexity (K) and sustained performance.
- **Convergence Patterns**: Solid lines (λ/μ configurations) peak earlier (t=0.5) than dashed lines (K configurations), which peak later (t=1.0).
### Interpretation
The graph illustrates how parameter tuning (λ, μ) and model complexity (K) influence test accuracy dynamics. Higher λ/μ values optimize early performance but may lead to overfitting or instability over time, as evidenced by rapid declines. Conversely, larger K values delay peak performance but maintain higher accuracy longer, potentially indicating better generalization. The trade-off between early peak accuracy and sustained performance highlights the need for balanced parameter selection depending on application requirements (e.g., short-term vs. long-term stability). The consistent bell-shaped curves across all series suggest a universal pattern of initial improvement followed by degradation, possibly due to model saturation or noise amplification.