\n
## Bar Chart: Fraction vs. Average Accuracy for Token Types
### Overview
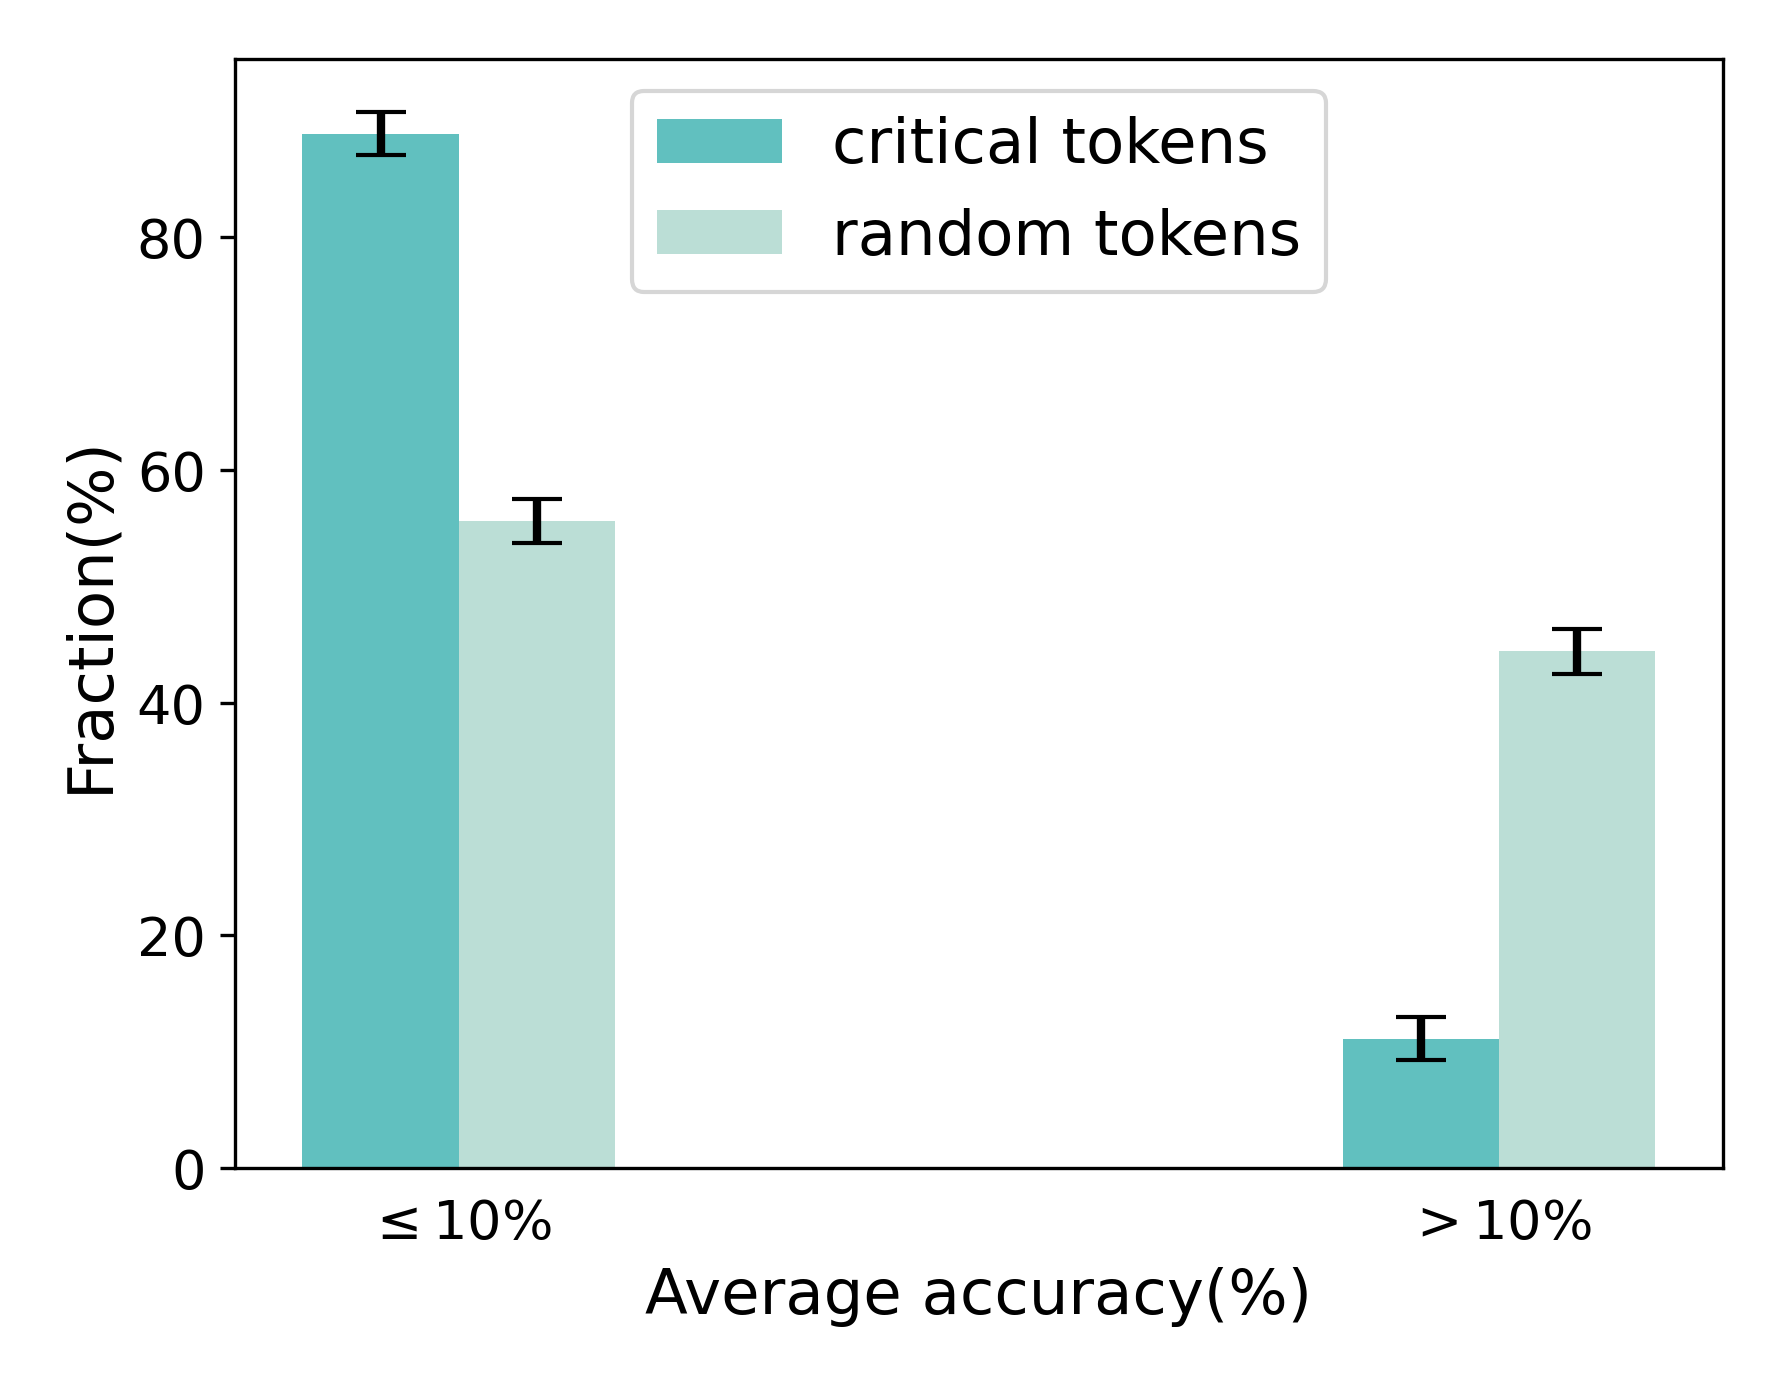
This bar chart compares the fraction of tokens based on average accuracy, differentiating between "critical tokens" and "random tokens". The x-axis categorizes average accuracy into two groups: "≤ 10%" and "> 10%". The y-axis represents the fraction, expressed as a percentage. Each bar also includes an error bar indicating the variability of the data.
### Components/Axes
* **X-axis Title:** Average accuracy (%)
* **X-axis Categories:** ≤ 10%, > 10%
* **Y-axis Title:** Fraction (%)
* **Y-axis Scale:** 0 to 90% (approximately)
* **Legend:**
* Critical tokens (represented by a teal/green color)
* Random tokens (represented by a light teal/green color)
### Detailed Analysis
The chart consists of four bars, two for each accuracy category, representing critical and random tokens respectively. Each bar has an associated error bar.
**For Average Accuracy ≤ 10%:**
* **Critical Tokens:** The bar is teal/green and reaches approximately 86% on the y-axis. The error bar extends from approximately 82% to 90%.
* **Random Tokens:** The bar is light teal/green and reaches approximately 55% on the y-axis. The error bar extends from approximately 50% to 60%.
**For Average Accuracy > 10%:**
* **Critical Tokens:** The bar is teal/green and reaches approximately 44% on the y-axis. The error bar extends from approximately 40% to 48%.
* **Random Tokens:** The bar is light teal/green and reaches approximately 12% on the y-axis. The error bar extends from approximately 8% to 16%.
### Key Observations
* For both accuracy categories, the fraction of critical tokens is significantly higher than the fraction of random tokens.
* The difference in fraction is more pronounced in the "≤ 10%" accuracy category.
* The error bars suggest a relatively high degree of variability in the data, particularly for the "≤ 10%" category.
### Interpretation
The data suggests that critical tokens are more likely to have lower average accuracy compared to random tokens. However, a substantial fraction of critical tokens still achieve an average accuracy greater than 10%. The large error bars indicate that there is considerable variation within each group, and the observed differences may not be statistically significant without further analysis.
The chart highlights a potential trade-off: critical tokens, while essential, may be more prone to errors or require more refinement to achieve higher accuracy. The higher fraction of critical tokens with lower accuracy could indicate areas where the system or model needs improvement. The fact that a significant portion of critical tokens *do* achieve >10% accuracy suggests that the concept of "critical tokens" isn't inherently tied to low performance, but rather that there's a performance disparity that warrants investigation.