## Bar Chart: Token Effectiveness by Average Accuracy
### Overview
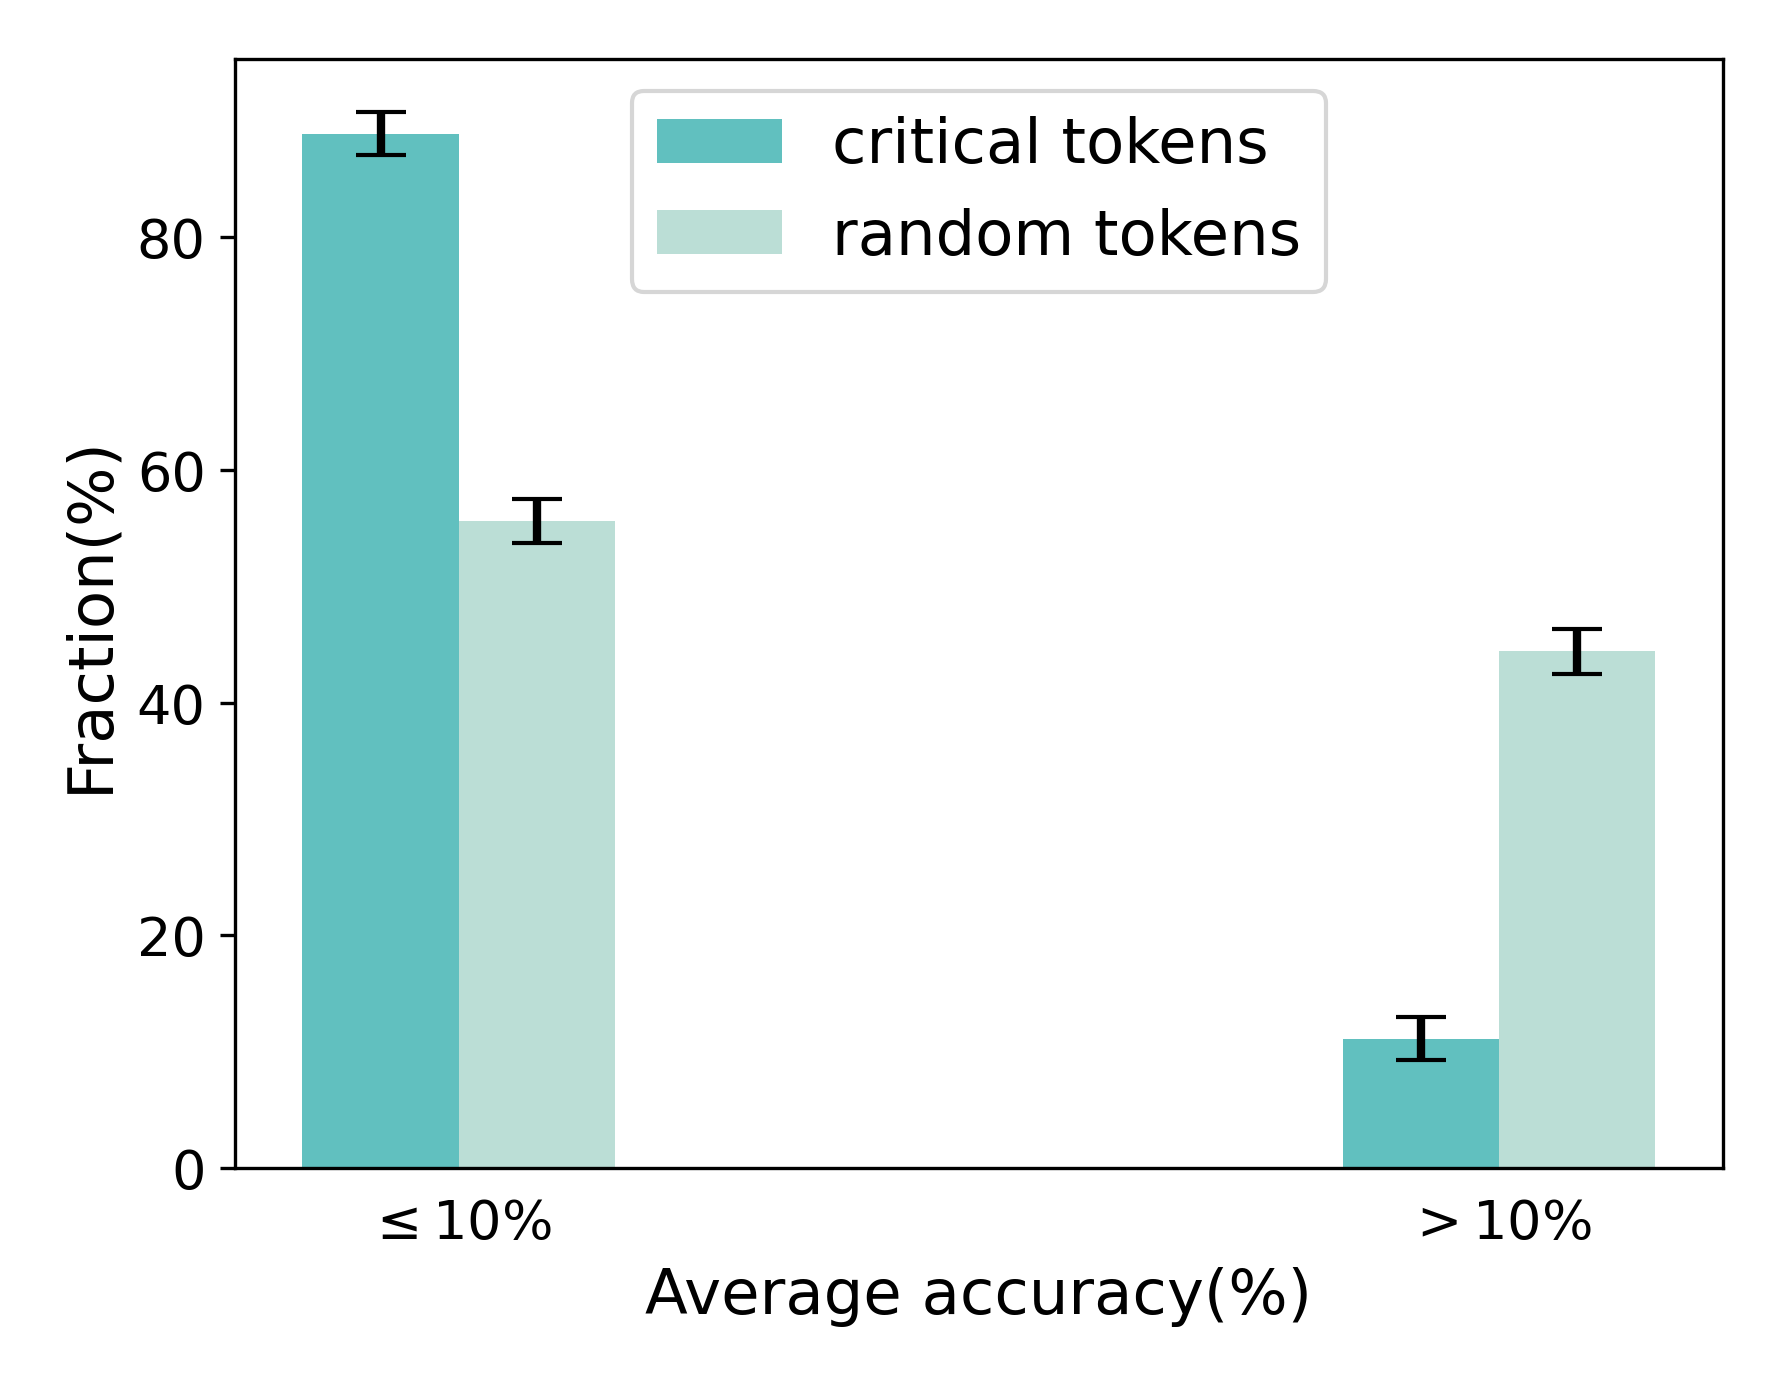
The chart compares the fraction of critical tokens and random tokens across two average accuracy thresholds (≤10% and >10%). Critical tokens (teal) and random tokens (light teal) are visualized with error bars indicating measurement uncertainty.
### Components/Axes
- **X-axis**: "Average accuracy(%)" with two categories:
- ≤10% (left)
- >10% (right)
- **Y-axis**: "Fraction(%)" ranging from 0 to 100%
- **Legend**:
- Teal: Critical tokens
- Light teal: Random tokens
- **Error bars**: Vertical lines atop bars representing ±2% (critical) and ±3% (random) uncertainty.
### Detailed Analysis
1. **≤10% Accuracy**:
- Critical tokens: 88% ±2%
- Random tokens: 55% ±3%
2. **>10% Accuracy**:
- Critical tokens: 10% ±2%
- Random tokens: 45% ±3%
### Key Observations
- Critical tokens dominate at ≤10% accuracy (88% vs. 55%) but collapse to 10% at >10% accuracy.
- Random tokens show a smaller drop (55% → 45%) across accuracy thresholds.
- Error bars suggest higher variability in random token measurements (±3%) compared to critical tokens (±2%).
### Interpretation
The data suggests critical tokens are disproportionately impactful at low accuracy thresholds but lose effectiveness as accuracy improves. Random tokens maintain a more stable presence, implying they may represent baseline or non-discriminative elements. The stark decline in critical token usage at >10% accuracy could indicate a shift in token relevance or model behavior under higher performance conditions. This pattern might reflect token selection biases in models trained on imbalanced datasets or tasks with varying difficulty levels.